LTC, giving us a chance to be a passenger on FLIGHT of the year!LTC is currently at correction phase -- and we all know this is a 'back to tarmac event' -- a chance for passengers to be in before the anticipated FLIGHT.
Current pricing will be archived soon -- and a new 3-digit pricing will be in play.
WEEKLY DATA is firm as it was before -- PRICE GROWTH imminent.
48 DAYS TO GO BEFORE HALVING. Days are getting shorter.
Net buy positions keeps piling up at the 80-90 price levels. No instructions needed, you know what to do.
Spotted at 88.0
TAYOR.
Safeguard capital always.
LTCUSDT trade ideas

LTC/USDT Gearing Up for a Next Bull Run?👀🚀 LTC Analysis 💎 Paradisers, brace yourselves for a captivating stage in #LTCUSDT's market trajectory, indicating a potential bullish rise from its present demand zone.
💎 After facing a setback from a significant supply zone at $79.14, LiteCoin has notably navigated through the buy-side liquidity. This development hints at the likelihood of a temporary dip before embarking on a bullish upswing from the key demand zone at $58. If LTC gathers enough bullish strength at this level, we could see an aggressive move towards confronting, and potentially surpassing, the strong supply zone above.
💎 In the dynamic and ever-evolving crypto market, adopting a strategy as agile as the market itself is crucial. If #LTC encounters hurdles in solidifying its position within this vital support zone, a quick and strategic alteration might be necessary for success.
💎 In such an event, we would shift to our Plan B: considering a bullish surge from a lower demand level at $48. This point becomes critical for monitoring, as breaking below it could signal early indications of a transition to a bearish trend in #LTC's market narrative.
💎 Stay agile and strategic, Paradisers. Your ParadiseTeam is dedicated to providing you with the latest insights and strategies, ensuring you're well-prepared to navigate these market shifts effectively.

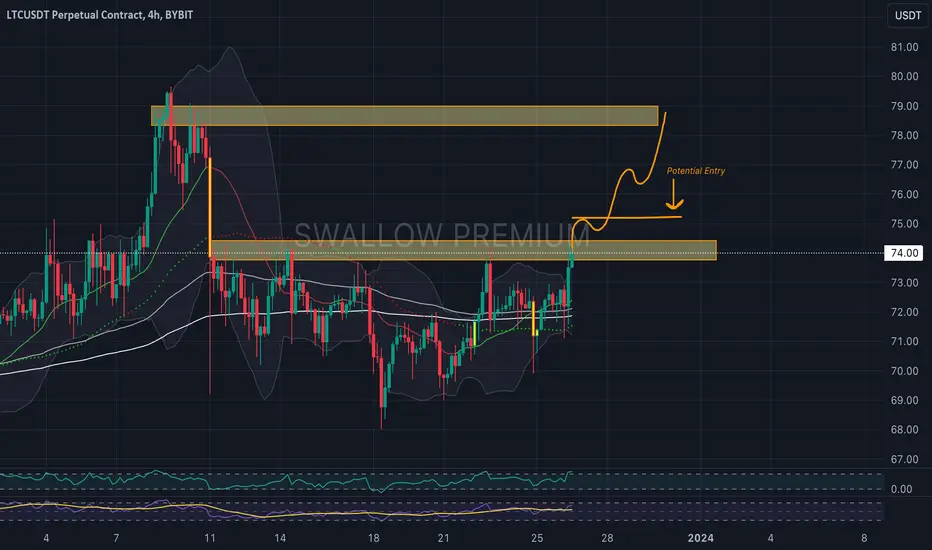
Litecoin(LTC): Can We See Another Drop?The LTC coin has caught our attention with some nice potential for history to be repeated!
We are seeing how, after forming some bullish trends, we have been eventually breaking them from time to time.
With that being said, we are seeing a similar outcome, where currently we had a breakdown and now we are entering the "sideways movement" phase.
During that phase, multiple positions can be taken, but as of now, this is just raw material, as we need to see if we will form any clear trends here!
Swallow Team

Seizing Opportunities: Analyzing LTC's Long-Term Support!LTC is currently trading above a significant long-term support level that has held for 1862 days, as evident from historical price interactions. This support has consistently resulted in a bounce for LTC whenever the price approaches it. While we anticipate another bounce, it is prudent to acknowledge the possibility of a breakdown. Fortunately, the risk associated with this trade is minimal due to a short stop-loss (SL). The trade appears favorable with a low risk and a potentially high reward.
Turning our attention back to the chart, the symmetrical triangle pattern observed indicates similarities with a previous breakout, leading to a substantial 500% increase. The formation of a similar pattern now suggests the potential for another breakout, which could lead to a significant upward movement. Noteworthy resistance levels during this anticipated movement include $79, $135, and the all-time high (ATH).
It is imperative to emphasize that this analysis is not financial advice. Investors are strongly encouraged to conduct their own research (DYOR) and base their decisions on individual risk tolerance and market comprehension.

LTCUSDLTC will soon make a decision as to which ML it will head towards next. In the past this current line has held very well and also been a spring for price. The R:R here is extremely attractive and hard to pass up. Manage your risk wisely and allow the move from here to play out.

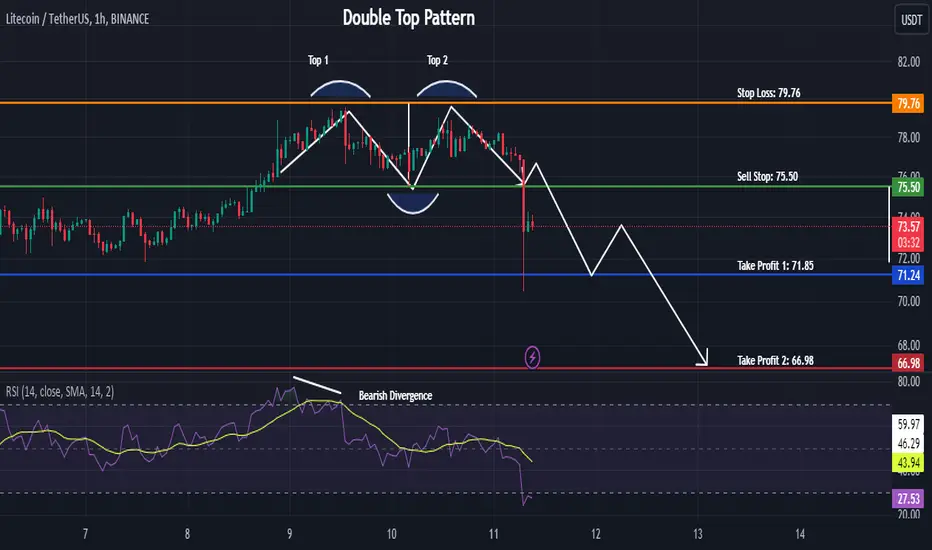
LTCUSDT - Double Top PatternDXY - US Dollar Index showing bearish reversal pattern.
- Bullish Trend Identified
- Bearish Divergence Spotted
- Reversal Pattern Identified
- Breakout Zones Defined
- Trade Executed
Litecoin: Bouncing FormationAfter finishing a long consolidation period in a triangle, LTCis breaking down the formation and turning to retrace. The price is falling from 44499 to 42544.
In the ascending triangle, as we see, price finished the ABCDE formation and is ready to rally. The current price range is similar to its previous legs, so an intraday sell appears.
We are assuming the price will reach the target and more sellers will participate in the market during the New York session.
I am with you as the market goes, and I will hopefully read your comments and opinions on the current price structure.
Follow tune.

LTC IS INCREDIBLY CHEAP - IN THIS MARKET CHEAP IS BOUGHT...CHECKLTC for years any time touched to this supportive trend made a huge movement.JUST act according to your risk management strategy , I am just a person like you guys but trying to catch my own opprtunities with all my care, investing with trivial amounts becase we cant risk monts of work in our lives, so dividen your cashier buy step by step , buy different coins so if delisted or about to be delisted like reef you dont hurt yourself much.


✴️ Litecoin Looks Pretty Bad (Weekly)It looks pretty bad... When a pair this big does this badly compared to others it means that there is no support from its own community, from the owners, miners and developers team...
Litecoin moved below EMA50 weekly in July '23 and recently dropped below EMA10 and EMA21, current session (this week).
This is a bearish as it can get but it trades so low already that potential for a drop is limited.
👉 Litecoin (LTCUSDT) is bearish and pointing toward lower prices, main target shown on the chart.
Invalidation can happen on a bullish break and close above $77 (moving back above EMA50).
Any trading below this level and this pair remains ultra-bearish.
Namaste.

LTC LOOKS BEARISHFrom where we entered "STAR", a corrective phase has started, something similar to ABC.
We have had a sharp movement in time, a correction movement in time, it is expected that we will have another sharp movement down in time by hitting the red supply box.
For risk management, please don't forget stop loss and capital management
Comment if you have any questions
Thank You

LTCUSDTPrice get rejected from the breaker block ..buy side liq been taken.. so I think We are now going to sell side liq.
Be safe
Mafioz


#LTC +200% BULLISH IN Q1-Q2 IN 2024#LTC Expecting Major Trendline in January 2024.
In Case of Successful Breakout, Looks Promosing for +200% Bullish Rally in MidTerm

$LTC Needs 3 WeeksI see a cup and handle-ish pattern considering there is a resistance level and it got its rejections from that level.
Fibonacci 0.618 level is at a meaningful spot
LTC is indeed in a ascending channel at the moment with its lower highs
The market is going well. pull backs are expected. I am not worried as long as it breaks the resistance level.
I see this as a good opportunity to place a position
The more confirmation I get, the more confident I will be
After a legit breakout my first TP is 81.05, and my second TP is 94.02
I do not expect a strong run to upper resistance level that's located at 103.24; however, I would aim it after a retracement.
What matters is the market at this very point, not the coin itself, so this idea would be invalid if the market isn't being nice. Technically speaking. get the joke? (side tony soprano smile)
as always, not a financial advice
duh

Ltccurrently ltc is on the support line created in 2017, in 2024 it could reach $400
This is not advice, just an observation, do your own research

LTC/USDT - Litecoin: Falling Wedge◳◱ On the $LTC/ CRYPTOCAP:USDT chart, the Falling Wedge pattern suggests indications that the trend may be gaining or losing strength. Traders might observe resistance around 74.14 | 77.16 | 83.25 and support near 68.05 | 64.98 | 58.89. Entering trades at 73.24 could be strategic, aiming for the next resistance level.
◰◲ General info :
▣ Name: Litecoin
▣ Rank: 22
▣ Exchanges: Binance, Kucoin, Bybit, Huobipro, Gateio, Mexc
▣ Category/Sector: Payments - Currencies
▣ Overview: Litecoin is a fork of Bitcoin's codebase with four times faster block times and a four times larger supply. The project considers itself complementary to Bitcoin as a silver to Bitcoin's gold. It is often used as a pseduo-testnet for Bitcoin, adopting new protocol changes before they are deployed on Bitcoin.
◰◲ Technical Metrics :
▣ Mrkt Price: 73.24 ₮
▣ 24HVol: 47,073,976.056 ₮
▣ 24H Chng: -4.086%
▣ 7-Days Chng: 1.27%
▣ 1-Month Chng: 5.74%
▣ 3-Months Chng: 7.66%
◲◰ Pivot Points - Levels :
◥ Resistance: 74.14 | 77.16 | 83.25
◢ Support: 68.05 | 64.98 | 58.89
◱◳ Indicators recommendation :
▣ Oscillators: BUY
▣ Moving Averages: SELL
◰◲ Technical Indicators Summary : NEUTRAL
◲◰ Sharpe Ratios :
▣ Last 30D: 1.57
▣ Last 90D: 1.19
▣ Last 1-Y: 0.42
▣ Last 3-Y: 0.26
◲◰ Volatility :
▣ Last 30D: 0.46
▣ Last 90D: 0.43
▣ Last 1-Y: 0.66
▣ Last 3-Y: 0.93
◳◰ Market Sentiment Index :
▣ News sentiment score is N/A
▣ Twitter sentiment score is 0.52 - Bullish
▣ Reddit sentiment score is 0.59 - Bullish
▣ In-depth LTCUSDT technical analysis on Tradingview TA page
▣ What do you think of this analysis? Share your insights and let's discuss in the comments below. Your like, follow and support would be greatly appreciated!
◲ Disclaimer
Please note that the information and publications provided are for informational purposes only and should not be construed as financial, investment, trading, or any other type of advice or recommendation. We encourage you to conduct your own research and consult with a qualified professional before making any financial decisions. The use of the information provided is solely at your own risk.
▣ Welcome to the home of charting big: TradingView
Benefit from a ton of financial analysis features, instruments and data. Have a look around, and if you do choose to go with an upgraded plan, you'll get up to $30.
Discover it here - affiliate link -

ltc . go upThe growing conditions are ready. We will soon see ltc BINANCE:LTCUSD.P BINANCE:LTCUSDT in the $140 price range

LTC 1W Right Angled Triangle There is a 1W right angled triangle and is hitting nearby resistance, thinking it breaks close resistance as weekly ADX is quite low

LTCUSD - Huge Double BottomA double bottom is forming on this daily chart for LTCUSD
This I expect to break out bullishly within this channel.
I do expect it to move way out of the channel it just was difficult to plot.
Bullish eventually.


LTC 🐂It seems that this coin has entered an ascending channel. The support and resistance lines are carefully drawn. The main target can be $100.

Litecoin(LTC): Going For A BreakoutLitecoin is showing some strength, pushing towards upper resistance, and potentially breaking it soon as well!
We are looking here for a clean breakout to happen in order to catch a potential long position!
Eyes open as if we will not see a clean breakout, then we will go back towards EMAs