LTC BUY SETUP (1H)This analysis is an update of the analysis you see in the "Related publications" section
We had previously signaled Litecoin at lower prices.
Based on the LTC chart and the formation of a valuable support zone, we can consider buying within the green zone with a target of $183-$202.
Litecoin has a bullish dominance and is genuinely lagging behind the market, which it is likely to recover soon.
The closure of a daily candle below the invalidation level will invalidate this analysis.
For risk management, please don't forget stop loss and capital management
Comment if you have any questions
Thank You
LTCUST trade ideas

LITECOIN short term-SHORTHello All 🐶😃🐼
It's Jazerbay here, I missed you all and I am back with this idea.. let's go ! 👇🏼⬇️⬇️🤸🏼♀️🤸🏽♂️
I have been watching Litecoin action on the short term time charts. I am noticing a very possible Head and Shoulders pattern forming 🐻
If this plays out we will see price drop to some of my projections, with 106 being the lowest for now😯🔥 This could happen pretty quickly if we don't stay above this support area of ~120-123.
Litecoin has been very bullish compared to other cryptos in the market for the last couple of days so if we catch support here then this projection is invalid 🙂
Thank you all for coming today and Happy Holidays
Good day
As always
🛑‼️ This is not financial advice, please trade at your own risk with caution 🛑‼️
☯️ jazerbay

Litecoin (LTC): Possible Smaller Correction Before Bullish Move!Litecoin has done a good movement to upper zones where the price just keeps on going and going. We are seeing a break of 2 major zones here where now we need to secure them, which means we might go for a smaller correction before a bigger movement to upper zones!
More in-depth info is in the video—enjoy!
Swallow Team

Buy Now...hello friends
Litecoin did not grow in this upward wave and was stuck below 120 dollars and this level was broken with both daily and weekly candles.
which has created a good spot position that can move to the specified goals as we specified.
And the minimum of this position is 99 dollars.
And as long as it doesn't go below 99, it can be an opportunity to climb.
follow us

LTCUSDT Breakout: Are You Ready for the Next Big Move?Yello, Paradisers! Have you been watching LTCUSDT lately? If not, it’s time to pay attention because things are heating up fast!
💎LTCUSDT has broken out of a descending channel and is now forming an inverse head and shoulders pattern, a classic bullish signal.
💎If LTC can break and close a candle above the resistance zone, this will confirm the pattern and significantly increase the likelihood of a bullish surge.
💎Now, if we see a pullback, watch closely! A potential double bottom could form at the support zone. For safety, though, waiting for an I-CHoCH (Internal Change of Character) to confirm a shift back to bullish market structure will increase the probability in our favor.
💎However, if the price breaks down and closes below the support zone, this invalidates the bullish setup completely. In this scenario, it’s smarter to wait for clearer price action before making any moves.
🎖Patience is key here, Paradisers. Don’t rush into trades—wait for clear confirmations to stay on the right side of the market! Stay sharp and trade smart.
MyCryptoParadise
iFeel the success🌴

$ltc new big trend LITCOIN ALL SET FOR BIG RALLY ⚡️🚀
CRYPTOCAP:LTC
This is looking like a best chart right now....
after CRYPTOCAP:XRP hype and move CRYPTOCAP:LTC seems the next best contender for big pump ↗️
Have a look at this juicy chart here 😉

Litecoin LTC price its time to wake up and playIs it time to resurrect the “old guard”?)
Crypto investment company Canary Capital has filed an S-1 application with the SEC to register a spot Litecoin-ETF.
Once upon a time, long ago, CRYPTOCAP:LTC was called “silver”, of course, after CRYPTOCAP:BTC - “gold”, giving more hope and prospects for #LTC than CRYPTOCAP:ETH at about the same price of $6-9 per coin :)
And most crypto transactions in those days were made in the #Litecoin network because of its cheapness and reliability, not usdt. At the same time, in 2016-2018, #LTC and #BTC were mined together on ASIC (we don't know how it is now, write in the comments).
👀 BTC ETF - done , ETH ETF - done , LTC ETF is next?
🟢 LTC and BTC have the same cyclicality of halving rewards for a mined block
🟢 #Litecoin is a reliable blockchain that has been tested by time (since 2011)
🟢 SEC regulatory requirements may be very similar to the already passed “thorny path” of BTC ETF
🟢 LTC, like BTC, unlike ETH, has a limited issue
many mined and “virgin” LTC are safely hidden in wallets and are waiting for their time to be sold at a very high price.
🔴 The only and big “minus” we see is the small capitalization of LTC. For a serious conversation with “big money”, you need to create a stir and pump up OKX:LTCUSDT price at least 10 times, then the #Litecoin marketcap will be $50+ billion
So, if you believe that LTC ETF will be the next one, it is a good idea to buy #LTC in the range of $60-70 with the prospect of growth to $225 (x3), and ideally to $700+ (x10)
_____________________
Did you like our analysis? Leave a comment, like, and follow to get more

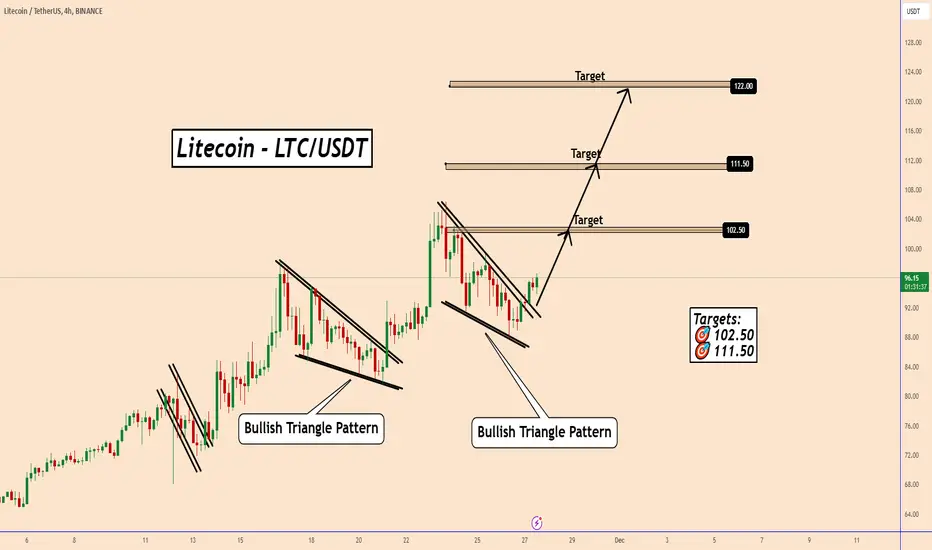
LTC Confirmed for a Bigger Bullish WaveLTC Confirmed for a Bigger Bullish Wave
LTC has broken out from a clear bullish triangle pattern, confirming that the price may rise further in the coming days.
If we look at the previous pattern, it is very similar to the current one. The bullish optimism surrounding the crypto market can push LTC even higher.
Two conservative targets I am looking at are 102.50 and 111.50.
Targets:
🎯 102.50
🎯 111.50
You may find more details in the chart!
Thank you and Good Luck!
LTC.USDT - 1WLTC status is very very good. After a long effort, he managed to record a candle above his previous important resistance range.
Keep in mind that these ranges are worth buying

buy LTCUSDT at HL as the coin is simply following Dow theory by making HHs and HLs and it can be seen on the chart that after making a new high it makes a new HL near the drawn trendline so to grab the opportunity wait for the price to come down and as it will make new HL we can enter in the trade

LTC still in accumulation phase
LTC halving has just happened on 2nd August 2023. Compared to the previous halving in 2019, prices are similar but LTC's bases of today are more solide: trippled total adresses , doubled active adresses, doubled hashrate.
In my opinion, LTC is still in an accumuation phase in a big range $58-$114 and this would continue for months, maybe until the next halving of BTC. This range with some remarkable events (following Wyckoff method) is presented in chart. I'll base on this plan for potential setup.
-------------------------
Litecoin (LTC) is often referred to as the "silver to Bitcoin's gold" due to its similarities with Bitcoin (BTC) in terms of technology and functionality. Litecoin is an open-source project and operates on a decentralized network using blockchain technology.
Key features of Litecoin include: Blockchain Technology, Scrypt Algorithm, Faster Block Generation (4 times faster compared to Bitcoin), Fixed Supply, Segregated Witness

Here I buy Litecoin at $120Here I buy Litecoin at $120
I was watching the order books and a sell wall suddenly appeared at $120 before my eyes.
So now I'm buying litecoin at $120
On the spot market. No need leverage on altcoins. Leverage on Bitcoin and Ethereum only.
And Litecoin major supply shock is getting triggered
Crystal clear.
From the same director that triggered Bitcoin and Ripple supply shock
TRIGGERING LITECOIN SUPPLY SHOCK NOW. IN THIS MOMENT AT $120
you know, I'm a versatile trader
and I have a sensitive heart.
They often say no one knows what's going to happen
Until I show up and make them swallow their words
I always feel their emotions
Their denial and their confidence.
Their laugh reactions and their love reactions.
I feel their sentiment about the market with negative balances and broken heart
And then I come to save them before they fall apart
The countdown has just begun.
LOS ANGELES, CHICAGO, NYC
Leftists ruined them
THE ONLY ONE LEFT NOW IS MIAMI.
You better stay away from Miami.
I'ma save Miami from cockroaches

LTC Breaks 2,200-Day Triangle – 250% Rally Ahead?BINANCE:LTCUSDT Technical analysis update
LTC price has broken out of a 2,200-day triangle pattern on the weekly chart with high volume. Additionally, the price has surpassed a 2-year resistance level that it tested multiple times before finally breaking through. This breakout, accompanied by strong volume, suggests a potential bullish move of 100-250% in the coming days.

Litecoin (LTC): 400% Away From ATH, Sleeper Build!Litecoin on a daily timeframe has a huge potential to move up to 400%, whereas on smaller timeframes we are witnessing a possible fakeout to form. 2 Timeframes with different directions; let's see where we will head 😉
More in-depth info is in the video—enjoy!
Swallow Team

$LTCUSDT game planIM expecting good pull back here. around $73 I will add into my portfolio.
my entry and exit prices on the chart
** Please LIKE 👍, FOLLOW ✅, SHARE 🙌 and COMMENT ✍ if you enjoy this idea! Also share your ideas and charts in the comments section below! This is best way to keep it relevant, support me, keep the content here free and allow the idea to reach as many people as possible. **
#trading #BTC #bitcoin #coin #scalping #crypto


Litecoin Pre-2025 Bull-Market Accumulation Zone & StrategyLitecoin is ready...
In late 2020, Litecoin hit a low of $41.
(In early 2020 the low was $25.)
Litecoin peaked at a high of $413 in May 2021.
Let's do the maths for these two lows...
1) From 41 to 413 = 907% total growth.
2) From 25 to 413 = ~1550% total growth.
In mid 2022, Litecoin hit a low of $40.
In August 2024, Litecoin hit a low of $49.
➖ From June 2022 through August 2024, we have a 784 days long accumulation phase. Litecoin is preparing for a major bull-market; a major, huge, big, bullish wave.
Litecoin is ready and the accumulation zone is now active.
It is a big range, as usual, and soon you will understand why.
We are defining Litecoin's accumulation zone price range as, $40-$65.
Or it can be wider: $30-$70.
It is a wide range because growth potential is huge.
Crypto is very volatile as the market is still relatively young.
We are looking at a long-term higher low, currently, but this can change. With this higher low in place, it implies a higher high next. A new all-time high in 2025.
Litecoin's ATH potential can go beyond $1,000, which is huge, considering the price at which the project trades now. That would be around 1,600% growth potential or 17X.
Now, smaller projects have higher potential for growth but at the same time, higher risk and volatility. Bigger projects have smaller potential for growth but at the same time, lower risk and better stability; see how that works?
And this is all without leverage... When using margin/leverage, the whole game becomes 5D. Just 2X, which is low risk, can make a huge difference... I will share some lessons on how to approach this market with leveraged trades in the future.
For now: No leverage, no margin = no risk.
You are not trading, you are just buying a token, an altcoin, and that's how it goes. The risk is there only if you decide to trade.
Before engaging in more advanced trading, it is very wise to first become successful in spot trading or in the least be aware of the major losses that you will incur while you learn the other system, and you can become addicted along the way. It is not guaranteed that you will learn to win with leveraged trading. It can happen that you become an addict and a loser until you finally quit and that's it. If you can't make money slow, you won't be able to make money fast. If you can't appreciate the small wins, you won't be able to grab the big ones. It is very complex because it is all psychological. An entire volume would be required to explain the psychology of trading successfully.
Anyway, Litecoin is ready.
You know the strategy; buy and hold.
Think of the long-term... Prepare for a nice and long two years wait. We expect/hope that the market will move in one year but we prepare for two.
The only way to lose is to not have a plan or lack patience.
If you plan ahead and develop patience; you won.
Thank you for reading.
You are appreciated, truly.
Namaste.

Are we ready for a spectacular rise in LTC/USDT?
Ltc/usdt broke the logarithmic downtrend and retested the trend line. It is currently in an all-time strong support-resistance area. With the volume break of this area and then a retest of this area, we can now see a strong rise. Ltc is currently a sleeping giant.

Litecoin is ready to moonIt is currently in a range box for a long time. By breaking the box and closing the daily candle, it is ready to reach the targets.
Entry:91_108
Sl:close daily candel below 84

Bullish Breakout Alert: Litecoin Targets $88.64After the dip in early August, Litecoin established a clear channel, moving consistently with higher highs and higher lows. The price has risen steadily from around $55 up to the $76 mark. The current structure suggests strong bullish momentum within this channel.
If Litecoin manages to break out from the upper boundary of this channel, it may test the next major resistance level near $88.64. This breakout could present an upside of about 14%, targeting a price of around $88.64. However, a failure to break out might lead to a retracement back to the channel’s lower support line.

Trading opportunity for LTCUSDTBased on technical factors there is a Buy position in :
📊 LTCUSDT
🔵 Buy Now
🪫Stop loss 89.00
🔋Target 1 111.00
🔋Target 2 120.00
🔋Target 3 130.00
💸RISK : 1%
We hope it is profitable for you ❤️
Please support our activity with your likes👍 and comments📝

Litecoin (LTC): Possible 18% of Drop Incoming? Litecoin had a good run to upper zones, but we noticed few signs that we might see a sharp re-test of EMAs just like we had previously with similar pumps on LTC!
More in-depth info is in the video—enjoy!
Swallow Team

LTC is still corrective.
Litecoin, despite attempts to build up a Move, still is being in consolidation mode. Price structure shows it quite vividly. Some transition pattern still needs to form before the awaited first impulse.
