#LTC Going For Double Digit Again..LTC Going For Double Digit Again.. For Liquidate early sellers and previous seller..
LTCUST trade ideas

LTC - correction continues SHORT The hype around the LTC halving did not change the Fibonacci corrective wave.
I use Camarilla pivots for greater precision. The move up during the halving met resistance at $96.5 on the Camarilla.
There is a Change of Structure (ChoCH) according to the Smart Money strategy. Downside direction.
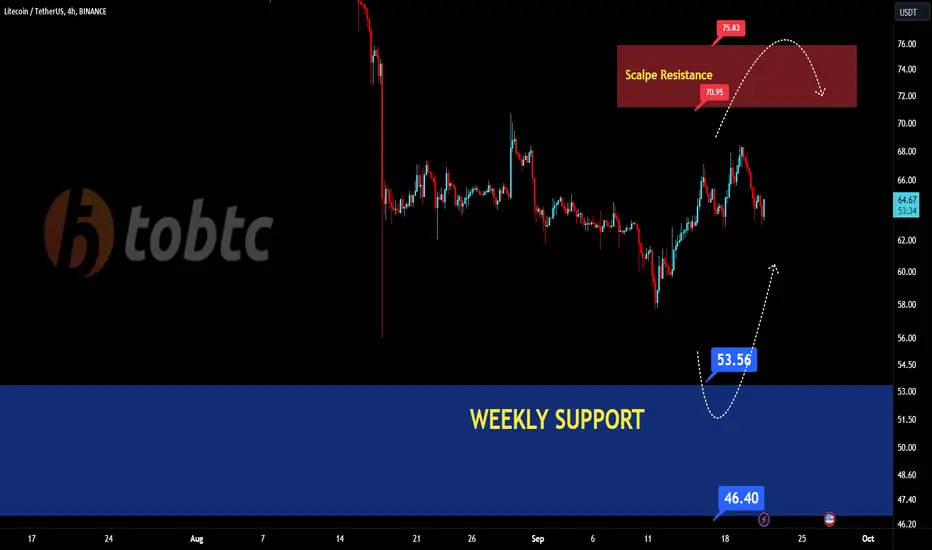
Buy zone or long-term investment - $61 - $67

Ltc forming diamond top? ♦️↘️Looks like a diamond top on the 4 hour after fully retracing a large liquidity pool.
I am long term bullish on litecoin but believe we about to see blood very soon

LTCUSDT.P Head and ShoulderBINANCE:LTCUSDT.P
LTCUSDT.P Has 3 Head and Shoulder potential with 3 scenarios.
1st it will touch the support area and reverse to downtrend
2nd it will pass the support area and retrace from 78,6% of Fibonacci level
3rd it retrace from 78,6% of Fib and make consolidation in support area
Or you can enter market on neckline (resistance line) when the candle has the momentum

long idea on $LTCI expect another dip to local lows, which will serve as a good entry point for a long time. you cannot set a stop above the level of $56 (if the candle is fixed below this price, exit the position)

#LTCUSDT #LQR #TOBTC #LaqiraProtocolThe price is in range. You can open a trade after confirming and matching the bitcoin levels. This analysis is not an offer to buy or sell
For past gloryHello?
Hello traders!
If you "Follow" us, you can always get new information quickly.
Please also click “Boost”.
Have a good day.
-------------------------------------
(LTCUSDT chart)
(1D chart)
While trading futures, there are times when you need to check the big picture movements.
That's when a trade doesn't go well or when a big uptrend is expected.
Looking at the big picture of the LTC chart, we can see that the current HA-High indicator point at 99.58 corresponds to an important turning point.
This roughly means that we need to consider whether we can hold it during the 52% uptrend.
Long-term holding like this is only possible when there is low leverage or a small investment proportion, but in reality, there is little chance of overcoming this upward trend.
If you hold it, it is expected that you will have to overcome two major crises.
1st: 78.47
2nd: 90.43
We need to check whether the price will rise in the 1st and 2nd areas above.
(1h chart)
It touched the HA-Low indicator and rose, and continued its upward trend along with the HA-High indicator.
However, now the HA-Low indicator has been touched again.
Therefore, we can see that we have reached a trend reversal section.
Therefore, the key is whether it can be supported and rise in the 64.06-64.92 range.
If not, there is a high possibility that it will turn into a downward trend.
However, since the 62.35 point is the point where the HA-Low indicator on the 1D chart was formed, there is a high possibility that a rebound will begin around this point, so caution is required when entering a SHORT position.
If the price rises above 64.92 and holds, the target range is around 67.35-67.18.
--------------------------------------------------
- The big picture
The full-fledged upward trend is expected to begin when the price rises above 29K.
This is the section expected to be touched in the next bull market, 81K-95K.
-------------------------------------------------- -------------------------------------------
** All explanations are for reference only and do not guarantee profit or loss in investment.
** Trading volume is displayed as a candle body based on 10EMA.
How to display (in order from darkest to darkest)
More than 3 times the trading volume of 10EMA > 2.5 times > 2.0 times > 1.25 times > Trading volume below 10EMA
** Even if you know other people’s know-how, it takes a considerable amount of time to make it your own.
** This chart was created using my know-how.
---------------------------------

What Is Next For LTCExpecting price to drop to $60 before price returns bullish or as illustrated on the chart it could start if trip to $74 in short-term

Results Speaks LTC NYSE:LTC
Fast, Sharp, Precise & Accurate. That's what you get from @DewyCandles
6% without leverage. #FOMC
📌 🎯 💯 ✅

LTC 15 MINUTES TIMEFRAMEprice can either start going down right away or it could consolidate for some time around the circled area before dropping at least 5%

Plan Ahead: SETUPS for ETH, LTC and DISHi Traders, Investors and Speculators of Charts📈📉
The markets are trading in the red and it can be hard to spot good trading opportunities during bloodbaths. However, that doesn't mean that you can't still find good trading opportunities.
Some of the setups in the video might come sooner than others; because crypto is more volatile than stocks I always expect crypto to move first, or with more extreme movements than stocks.
A few more high-reward low-risk setups here:💥
_______________________
📢Follow us here on TradingView for daily updates and trade ideas on crypto , stocks and commodities 💎Hit like & Follow 👍
We thank you for your support !
CryptoCheck

✴️ Litecoin Reversal Pattern | Great Entry Point ConfirmedLitecoin hit a major low 17-August, the lowest level/price since November 2022, making this date a long-term higher low.
This is a full "reset", a very strong price correction.
A higher low short-term is hit 11-September and today we have a full green candle above EMA10 and EMA21, with bullish indicators.
This can be a great entry point based on these signals, this pair looks ready to grow. The short-term bias is clearly bullish, other major Altcoins also ready to grow.
We shared a long trade for this pair 15-Sep.
That's how strong we think of this chart setup.
Namaste.

LTC/USDT Review ChartGoing further, we will check what the situation on LTC looks like, taking into account the four-hour interval. let's start by marking the downward trend channel with blue ones, from which the price went up and started moving along the local upward trend line, above which it is currently staying.
At this point, it is worth marking the first and current second attempt to return above ema cross 20o to the upward trend, which has been rejected at this time.
After unfolding the Trend Based Fib Extension tool, we can mark the first support zone from $64.86 to $62.94, then we can mark the second zone from $59.85 to $57.66, and then strong support at $54.84.
Looking the other way, we can similarly determine the resistance areas that the price must face. And here we see that currently the price has been rejected by the resistance zone from $66.70 to $69.17, only when it is broken we will see an attempt to attack the resistance at $72.30.
The CHOP index indicates that most of the energy has been used, on the RSI we approached the upper limit, to which the chart reacted with a price recovery, while the STOCH indicator indicates that currently the energy needs to recover before the price increases further.

LTCUSDTAfter halving majority thought this will be bulish and price will go up to take old highs .. but We are in bariesh market and market sintement is bariesh. there is decline in liqudity for many reasons .
I think price will go down to the liqudity pool and accumulate in discounted price.
smart money with their unlimted funds always but in disccount are ..
Hope clear picture you got and sorry for my poor English.
Be safe

A possible uptrendThere is every possibility of market returning to the 63 dollar zone before starting an uptrend

LTCUSDT Sell Limit we see consolidation on Litecoin 101.53 is sell limit level, TP around $92,50 ... Hope all moves will be bullish in crypto world...
