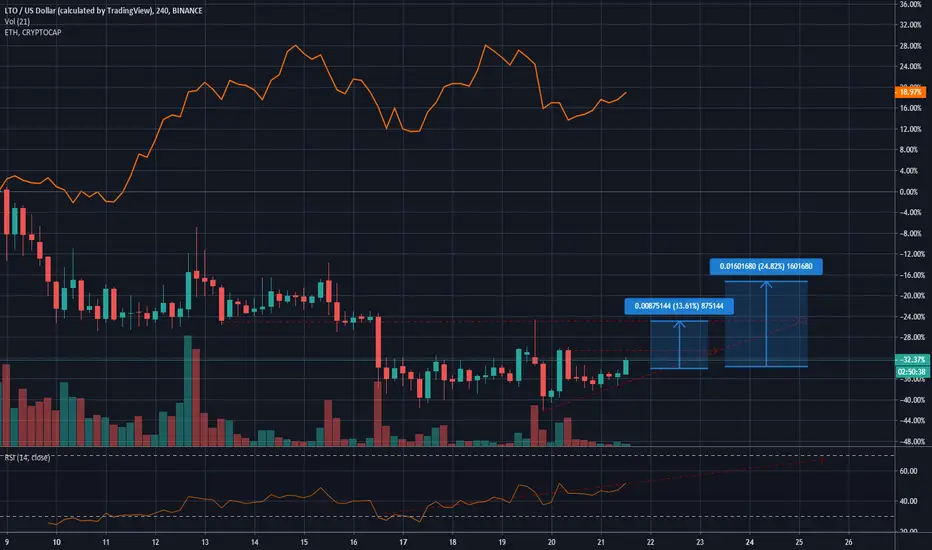
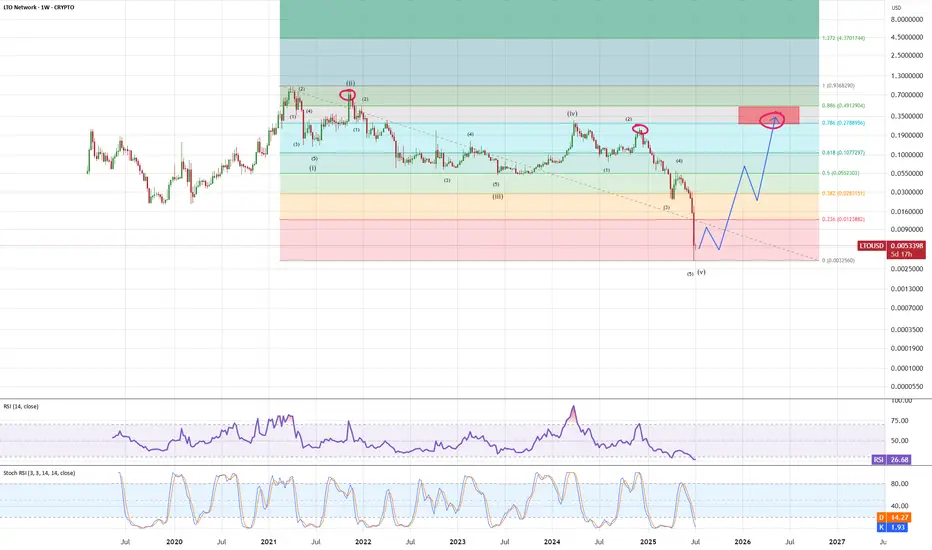
LTO - capitulation dump before strong push up?LTO lost support at 0.05$ and did massive dump. This looks now like completed impulse to downside with significant capitulation dip. We are oversold and when looking similar structure on lower timeframes we see that bounce up was usually very strong (push to fibb 0.786-0.886 range) so I am expecting similar action also now - bounce and strong push to test 0.25-0.50$ range.
LTOUSD trade ideas
LTOUSD Weekly analysis, will LONGGo long at the lower boundary support position of the purple-red rising oscillation range

LTO - Octopus strategy with Da Vinci retracement 50% up or downEntry levels
0.0550$ - If BTC Goes down to 10.000$ expect this as Macro bottom
0.0620$ - most likely will hit before February 2023
Octopus entry:
1. 0.0715$ If BTC retest 15k
2. 0.0735$ If BTC bounce back from 16k
3. Octopus Anchor sand range: 0.12$ - 0.16$ ( 7 legs fighting 1 hold the rock as anchor)
Leonardo da Vinci retracement exits with Focaccia in mind:
Leg 1. 0.22 $ Load off 20% of portfolio * Hold 80% * Buy back 0.10$ >
Leg 2. 0.36 $ Load off 35% of portfolio * Hold 65% * Buy back Octopus Anchor sand range from 0.12$ - 0.16$
Leg 3. 0.60 $ Load off 50% of portfolio * Hold 50% * Cry like a baby because you were sleeping and not buying 0.45$ just FOMO into 0.72$ and wait 1 more month
Leg 4. 0.90$ Load off entire portfolio * Buy house and make some kids
Leg 5. 1.20$ Only for the humans that forgot wallet phrase or password (Ethical hacker saved the day brute forcing their wallet for 30% of portfolio)
Leg 6. 1.70$ My target as I can only be artist as good as Leonardo with all these Fibonacci BS and this is year 2025
Leg 7. 6.78 $ Peak of LTO before starts collapsing and dying as company year 2028
If you like my idea buy LTO at:
0.0550 - 0.0750 $ or FOMO into Octopus anchor and thank me later for just x6 missing this golden opportunity on 0.0550$ - 0.0750$ range
IF you see Blackrock or Vanguard start investing into LTO sell everything.


LTOUSD - SYMMETRICAL TRIANGLE BREAKOUT 1D TFSymmetrical triangle breakout and a possible continuation of bullish pattern


#lto how further If you have any questions plz ask. All the credits go to my teacher Thomas Bulkowski. DYOR

LTO Elliott wave projectionAnalysis based on Elliott wave projection
Black lines are for exiting your position gradually

LTO Bullish Scenario USDLTO is looking very bullish at the moment. As you can see from a FIB perspective, we had a very bullish bounce off the .618 in macro wave 2 correction. The RSI QUICKLY reset for further bullish momentum. With good volume, I would expect wave 3 to target the 1.618 fib level which would put the target at about $1.26. Profit taking can take place at previous high and 1.618 fib levels. Remember this is the daily chart so we would want these positions to take place in the next several weeks for LOW-RISK trading strategies.
In my opinion, the growth in the last several weeks/months has been organic without massive whale movement or manipulation. This is something to keep an eye on. I would definitely start thinking about entering a long here to catch wave 3. BUT, be sure to keep an eye out for the previous high as this is going to act as a resistance until it is broken, which would keep our wave 3 target in place.

LTO Parabolic MoveLTO is a very strong and highly undervalued coin. I see a parabolic move setting up with striking similarities to that of the start of Luna's massive run. The relatively low supply and long accumulation period give this coin great upside potential. This is a great proven project that should be on everyone's radar.
This is not financial advice.
BS


The chain that has clients this chain is compared to chains that are only concept way to cheap
because this one got clients before it even went to the big exchanges.
these guys got operational within their ico sale budget .
hats off for that.