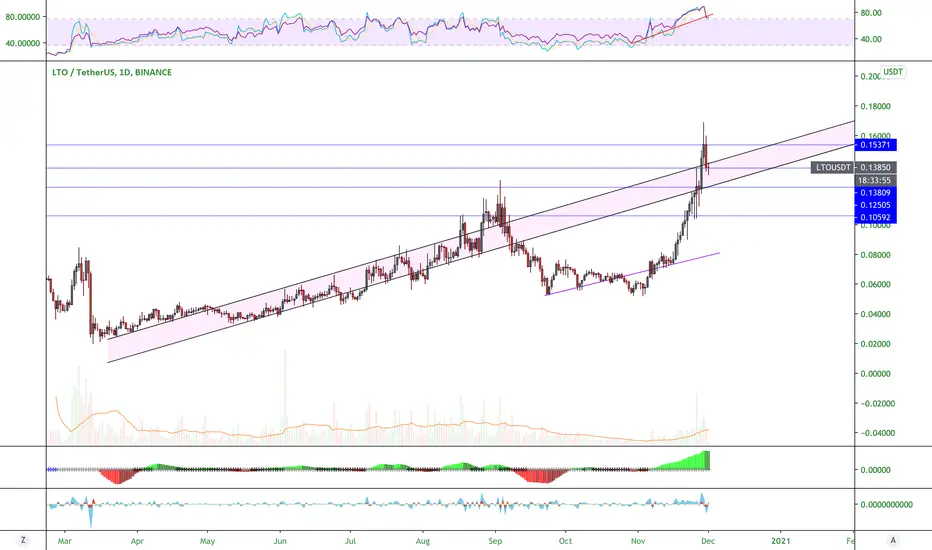
LTO Post-Breakout UpdateLTO decided to forgo the cup and handle idea and decided to go straight to all time highs - definitely not complaining. It has been following this particular channel since March, before a failed breakout and retest made it lose it. LTO traded below the channel for two months, before bottoming out, reclaiming the channel and is now retesting the upper trend line. It looks like it is retesting the lower trend line before proceeding with its price action. I am expecting it to retest the previous range highs, anywhere around the .11-.125 before continuing it's uptrend. This would form the handle, similar to the previous idea.
Previous idea, detailing the breakout.
LTOUSDT trade ideas

LTO/USDT Huge cup and handleLTO is showing a just finished cup and handle on the daily.
Wouldn't it be great if that plays out!
The target is not even visible in the chart!
Please share your opinion

LTOUSDT - Long - Potential - 12.63%LTOUSDT - Long - Potential - 12.63%
Entry- 7959
TP1- 8314
TP2- 8956
SL- 7469
- RR - 2.05
- Trailing Buy - 0.5%
- Trailing Profit - 1%
- Trailing Stop-Loss - No

LTO Attempting Break OutLTO bottomed, and has gotten back on track. It is going into one of the important price ranges, around the .08 and .088 areas, which have been very important in it's past price history. The pink drawing shows my ideal path - with LTO creating a cup and handle, before setting new all time highs. Not guaranteed, but not entirely unlikely.

LTO/USDT - Long - Potential 15.50%*NEW TRADE SET-UP*
LTO/USDT - Long - Potential 15.50%
Optional Leverage: N/A
Entry- 7757
TP1 (75%) - 8413
TP2 (25%) - 8957
SL- 7095
- BTC rise halted - ALT's to rise
- RR - 1.82
- Trailing Buy - 0.5%
- Trailing Profit - 1%
- Trailing Stop-Loss - No


Ascending TriangleLooks like an ascending triangle formation on LTO is forming, the breakout is incoming.

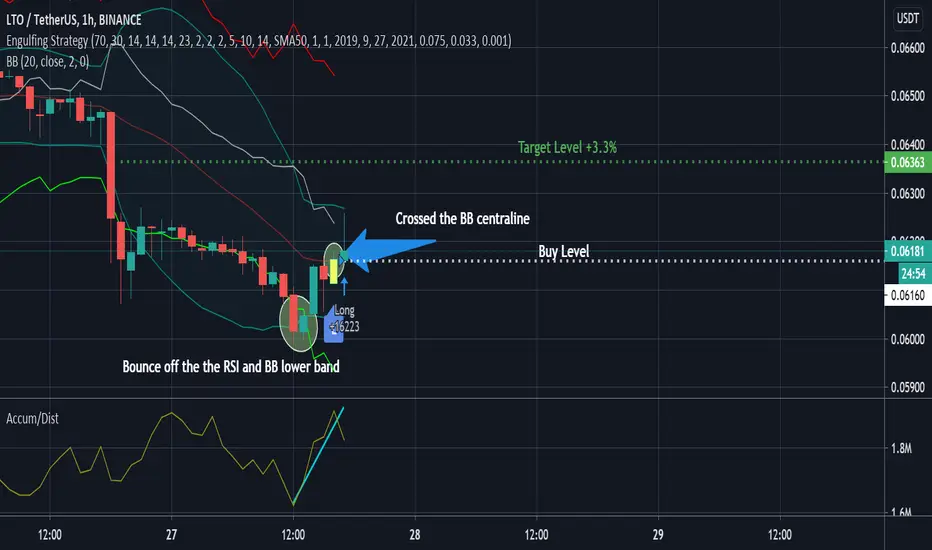
LTOUSDT Engulfing SignalToday, our Automatic Engulfing Strategy executed the long position for the LTOUSDT as a result of revealed potential price growth.
The Accumulation/Distribution Indicator demonstrates the increasing bullish activity. The price bounced off the RSI and BB support lines, which means the trend reverse. The uptrend is also confirmed by the intersection of the BB centraline.
As a result, we expect the 3.3% price growth from 0.06162 to 0.06365. The alert was automatically executed by SkyRock Signals trading bot.
LTOUSDT AnalysisAt the moment, there are 3 sell signals present and I'm BEARISH.
So, I don't think this is a good time to buy.
If you want to buy again, we have 4 different options.
1- You can wait for EngineeringRobo's BUY signals to be present,
2- You can wait for candles to open-close above resistance level (0.11) for 1D to buy,
3- You can buy when candles touching the support line (0.055)
4- You can buy when candles open-close above up trend line.
After you buy, please watch out for EngineeringRobo's sell signals and consider selling it.

LTOUSDT Intraday Trading OpportunityDear Subscribers,
Technical analysis with the Automatic Engulfing Strategy revealed the price reverse opportunity from the downtrend to uptrend.
On the one hand, the increased bullish pressure is confirmed by Ichimoku Cloud Indicator. On the other hand, the price has a bounce off the support RSI line after the dramatic decline.
As a result, We expect the 3.3% price growth from 0.06372 to 0.06582. The alert was automatically executed by SkyRock Signals trading bot.

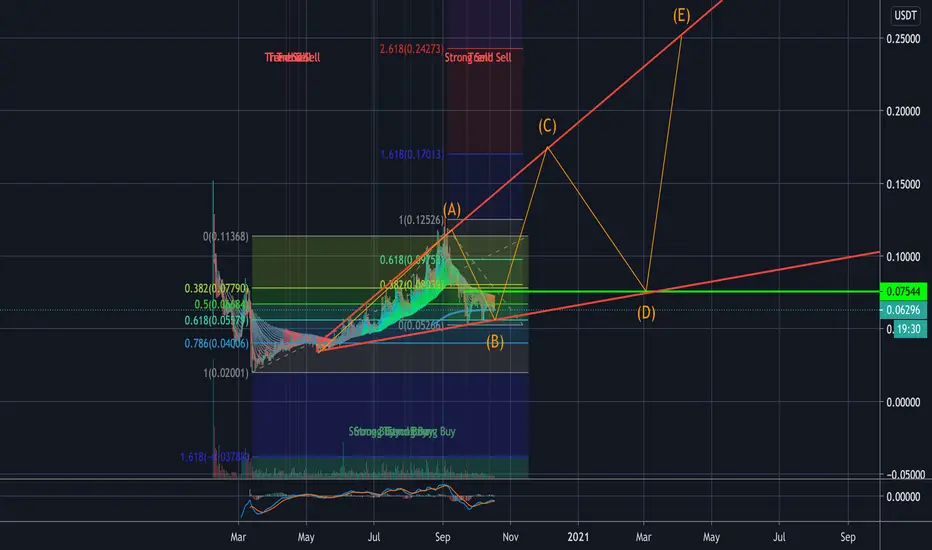
Possible LTO Expanding TrianglePossible Long term play for LTO, looks like an expanding triangle is happening, interested to see how this plays out.

LTO bounces and next leg up!A bounce from the 200 Day MA & Golden pocket from the 61.8 FIB retrace, plus MACD turning to bullish on the daily... good things are coming for LTO.

LTOUSDTHi to all traders!
The chart is clear enough and well explanatory.
IF You Agree Hit The Like Bottom And Support Me.
The Information Provided Is Not Trading Advice But An Informative Analysis Of The Price Movement.


LTOUSDT ANALYSISI have 4 positive signals
If you hold this coin sell at the resistance line ( $ 0,12690)
Buy this coin when the resistance line turns to support line other case wait for EngineeringRobo ' s other buy signal
After buying this coin watch carefully EngineeringRobo ' s sell signal
Unfortunately, EngineeringRobo gave Sell 1 & Sell , Bear and Sell 3 to Bitcoin, I am not strongly recommending to buy any altcoins at the moment
Have a good trade , if you want to use EngineeringRobo please dm me.


LTOUSDT - Long - Potential 34.15%LTOUSDT - Long - Potential 34.15%
Enter- 0.11351
TP1- 0.12473
TP2- 0.15220
SL- 0.09834
Happy Trading! Like and Follow if you Agree!

LTOUSDT analysisMA20>MA50, buy1 and buy2 signal . Here is my analysis:
1. We can buy when risk/reward ratio is greater than 2 = 0.075usdt
2. We can buy at support = 0.0676usdt
3. We can buy when resistance turns to support = 0.09672usdt
We can use sell2, sell1 or when MA50>MA20 signal for sell decisions. Otherwise, we can also sell at resistance depending when you buy.

LTO/USDT breakout underwayOverview : LTO breaking out despite bitcoin's own breakout north of 12k. Look for a R/S flip to confirm continuation.
Analysis : LTO has been in a healthy uptrend channel since the end of May. The ebb and flow of the gains and pullbacks have been organic and measured. Something chartists should love to see. The overhead resistance is limited at the .125-.126 area in the USDT pair. That leaves a lot of room for growth, and possibly an opportunity to pull back and allow traders to find a second entry and/or take profits. The first line of support lines up with the .86 area, give or take. You can always extend the channel up and use that as a way to find additional entries, lines of support, and future lines of resistance, where support doesn't hold up.
Deeper Dive : In scenarios where higher lows and higher highs constitutes the bulk of the current trend, traders might find it difficult to locate areas of support. Most often, we can rely, at least to some degree, on the prior higher high as an area of support. I've been watching this chart for awhile, but didn't get around to publishing an analysis until today. A little late for some, probably. Sorry about that.
Comments : LTO looks like a slow grower, and worth consideration as a medium to long term trade. Bitcoin's price action was no hurdle for the breakout today, but I would be surprised if it holds up against a stronger bitcoin move up, or down. It's a smaller cap coin, so take that into consideration when planning your risk management strategy moving forward.
Final Note : Looks like this breakout escalated quickly as I wrote this analysis, but everything I have already written holds true. Watch the LTO/BTC pair as well for additional, alternate lines of resistance that are likely to overlap with the USDT pair.
Good luck.
"Every day is a little life, every waking and rising a little birth, every fresh morning, a little youth, and every going to rest and sleep, a little death."


