#LTOUSDT Breaks Out—but Is This the Start of a Rally or a Trap?Yello, Paradisers! After months in a brutal downtrend, could #LTOUSDT finally be ready to reverse course? Let's discuss the latest #LTONetwork analysis:
💎#LTO has finally managed to breakout from the descending triangle and seems ready to rally. This breakout from its descending triangle is promising and is ignited by a bounce off the critical demand zone at $1.04. But hold on—before we get too comfortable, there's a strong possibility we could see a retest of this support.
💎To keep the rally alive, #LTONetwork needs to break through the minor resistance level at $0.138. This is a critical hurdle; if the bulls can push past it, we might see a more powerful surge. A move through $0.138, coupled with rising volume and the backing of the 50EMA, could confirm that the bulls are finally gaining control. Watch this level closely!
💎But, if momentum fades here, a pullback becomes likely. Be prepared for the price to revisit the breakout zone or even test the major demand area at $1.04. Should this support fail to hold, we’re looking at a potential drop to the next major support between $0.078 and $0.085.
💎A break below $0.078 could swing the control back to the bears, paving the way for a deeper correction and squashing any near-term bullish hopes. Trading at these levels requires vigilance, Paradisers—stay strategic and cautious.
Stay focused, patient, and disciplined, Paradisers🥂
MyCryptoParadise
iFeel the success🌴
LTOUSDT trade ideas

LTOUSDT 5DLTO ~ 5D
#LTO This coin is in the LSE:RWA sector. If you have Conviction on this coin. This support block would be an excellent buy spot for now. buy in stages with a minimum target of 20%++

LTOUSDTLTO ~ 5D
#LTO This coin is in the RWA sector. If you have Conviction on this coin., this support block would be a very good buy for now.
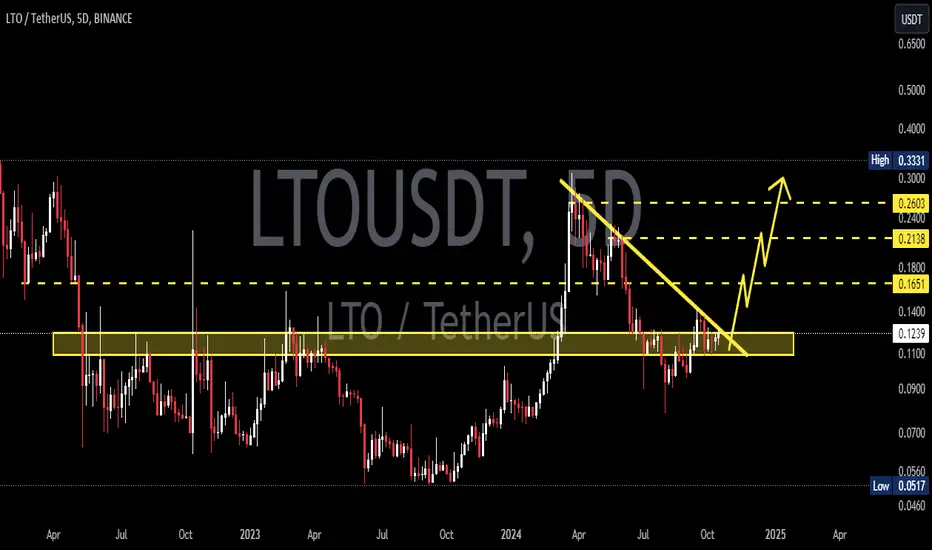
Ltousdt trading opportunityLtousdt has been establishing a corrective phase with the price action forming a falling wedge, signaling a potential bullish reversal. The price recently reversed after testing a critical internal demand zone, where buying pressure initiated a strong breakout.
This breakout pushed the price up to test the $0.3091 level, which now acts as the immediate neckline zone. However, a rejection from this neckline has resulted in a pullback, driving the price back towards the previously identified buy-back zone. This zone remains valid and may serve as a crucial support area, potentially experiencing another retest before a final upward momentum.
The overall structure suggests that after consolidating or retesting the buy-back zone, the price could see a continuation of the upward push, with the projected target set towards an external supply zone. Given the current setup, it's essential to monitor for sustained volume and momentum as confirmation for the next bullish leg.
I’d love to hear your view on this coin’s movement and if you see any additional key levels or factors influencing its price movement.

#LTO (SPOT) entry range below ( 0.1290) T.(0,1536) SL(,1218)BINANCE:LTOUSDT
entry range below ( 0.1290)
Target (0.1536)
SL .4H close below (0.1218)
1:3 Trade
**** #Manta ,#OMNI, #DYM, #AI, #IO, #XAI , #ACE #NFP #RAD #WLD #ORDI #BLUR #SUI #Voxel #AEVO #VITE #APE #RDNT #FLUX #NMR #VANRY #TRB #HBAR #DGB #XEC #ERN #ALT #IO #ACA #HIVE #ASTR #ARDR #PIXEL #LTO ****

ROI for LTO 1563%?LTO Network (LTO) is one of my favourite coins which I choose to invest in. I like this project because they have a lot of partnerships and projects on their site. Also they are involved in Web3 and NFTs.Some of their partners are United Nations, IBM, Dutch Government etc. This is trade (investment) setup on larger timeframe. I am not looking to reach targets 2,3,4,5 and 6 very soon, that could be year(s). I will sell most of my capital on targets 3,4 and 5. Small portion will be sold on Target 1,2 and 6.
Entry Zone: 0.06 – 0.09
Buy Zone 1: 0.023 – 0.035
Target 1: 0.25 – 0.29 (171%)
Target 2: 0.40 – 0.44 (328%)
Target 3: 0.68 – 0.71 (622%)
Target 4: 0.89 – 0.91 (837%)
Target 5: 1.23– 1.27 (1193%)
Target 6: 1.58 – 1.63 (1563%)

#LTO/USDT#LTO
The price is moving in a descending channel on the 12-hour frame and is sticking to it greatly and is expected to break it upwards
We have a bounce from a major support area in green at 0.0900
We have a downtrend on the RSI indicator that was broken upwards, which supports the rise
We have a trend to stabilize above the 100 moving average, which supports the rise
Entry price 0.1000
First target 0.1220
Second target 0.1318
Third target 0.1455

Is LTOUSDT on the Brink of a Major Move? Yello, Paradisers! Are you ready for the next potential big move on #LTOUSDT? Our latest analysis suggests a pivotal shift in momentum that could either send this asset soaring or plummeting. Let’s break it down!
💎 GETTEX:LTO is currently holding a key support level within a descending channel, increasing the likelihood of a bullish continuation. The critical zone to watch is the $0.0893 support level, where bullish momentum is beginning to build. If this support holds strong, we could witness a significant push towards the descending resistance—and possibly see a breakout above it.
💎If #LTO maintains its upward momentum, potential targets lie at the resistance levels above. This could mark the beginning of a substantial rally, so keep a close eye on those price levels.
💎But as always, we prepare for all scenarios. Should #LTO fail to hold the $0.0893 support and break below it, we could see a bearish trend take over, potentially leading to a sharp price decline.
This is a critical moment for LTOUSDT. The coming days could define its next major move, whether it's a surge to new highs or a correction to lower levels. Remember, in trading, staying disciplined is key.
MyCryptoParadise
iFeel the success🌴

#LTOUSDT in a Perfect Setup to Rally From the Key Support Yello, Paradisers! Have you been tracking the recent breakout on #LTONetwork? If not, it's time to pay attention.
💎 GETTEX:LTO has recently broken out of a descending resistance, hinting at a potential upward trend. The key level to watch right now is the $0.091 support zone, where bullish momentum is starting to build. If this support holds, we could see a strong push towards the next resistance levels.
💎Should #LTO maintain its upward momentum, we’re eyeing potential targets above current levels. The 20EMA is reinforcing this bullish outlook, so keeping a close watch on those price levels is crucial.
💎But as always, we prepare for all scenarios. If #LTOUSDT fails to hold the $0.091 support and breaks below, we might see a pullback to the lower bullish Order Block (OB) level. However, a drop below the $0.078-$0.083 range could trigger a bearish trend, potentially leading to a significant price decline.
The coming days could define its next major move—whether it's a surge toward new highs or a correction to lower levels. Remember, in trading, discipline is key. Stay focused and be prepared to act!
MyCryptoParadise
iFeel the success🌴


LTO Technical Analysis in a Weekly TimeframeHello everyone, I’m Cryptorphic.
For the past seven years, I’ve been sharing insightful charts and analysis.
Follow me for:
~ Unbiased analyses on trending altcoins.
~ Identifying altcoins with 10x-50x potential.
~ Futures trade setups.
~ Daily updates on Bitcoin and Ethereum.
~ High time frame (HTF) market bottom and top calls.
~ Short-term market movements.
~ Charts supported by critical fundamentals.
Now, let’s dive into this chart analysis:
LTO is in a downtrend, with the price close to the support level. The price has already dropped 74% from the local high, and it could fall another 30%-40% if the downtrend continues.
The support and accumulation range for LTO will be between $0.0534 and $0.080.
DYOR, NFA.
Please hit the like button to support my content and share your thoughts in the comment section. Feel free to request any chart analysis you’d like to see!
Thank you!
#PEACE

LTOUSDT 1D#LTO is pressing the triangle resistance on the daily time frame. It seems that it is ready for the next leg up. Wait for a breakout and then enter to this coin. Targets are:
$0.2426
$0.2702
$0.2977
$0.3368
$0.3867

LTO LTO / USDT
One of strong coins in in past few weeks
We can see it started to show strength again around one of its major support
As long as this support hold we can see nice bullish waves in the coming weeks
In worst case scenario if this support failed it will drop to 2nd major support in my chart
Best of wishes

LTO MIGHT BE INTERESTINGHello, we had an very successful LTO setup a couple of weeks back - and it looks like LTO wants more... Taking this level by level.

Long Trade Position LTOUSDTTest your analytical skills in the tradingview simulator with virtual money to become a professional. In spot trading, I will specify the entry points, loss limit and profit limit for you! The conditions for entering the trade and our strategy are as follows, when you notice that the market trend is increasing and at least two green candles close above the entry point in fifteen minutes, you can enter the trade from the beginning of the third green candle. Be patient and don't rush to enter! After the price reaches the first target, move your stop loss below the first profit limit so that if the price reverses, your trade will be closed with profit. Repeat the above strategy to continue the price targets shown on the chart. If the price reaches or falls below our loss limit before the above condition, entering this transaction is invalid because it must be re-analyzed and the new entry, loss and profit limits must be determined. Note that the market trend is formed with clever tricks by the market maker, so even the most powerful analyzes may be invalidated. The only thing we can do is to surf the waves and stick to our strategy so that while taking care of our capital, Let's make a profit. These exercises will make you experience profit and loss with virtual money in the real market and improve your analysis and personal strategy. Know your fear and greed and gradually control them so that your business becomes profitable and you suffer less loss.

scape from patternWe are careful to cross the first red resistance line up and exit the blue pattern.
If it exits with strength, there will be a very good growth ahead.
So be careful and watch.

The Bullish Case for LTOUSDT! A Comprehensive Analysis!!Hi.
BINANCE:LTOUSDT
😊Today, I want to analyze LTO for you in a WEEKLY time frame so that we can have a Mid-term view of LTO regarding the technical analysis. (Please ✌️respectfully✌️share if you have a different opinion from me or other analysts).
LTOUSDT printed a Descending Broadening Wedge below the key level on weekly timeframe
✅ Due to the Ascending structure of the chart...
- High potential areas are clear in the chart.
- Broadening Wedge
Stay awesome my friends.
_ _ _ _ _ _ _ _ _ _ _ _ _ _ _ _ _ _ _ _ _ _ _ _ _ _ _ _ _ _ _ _ _
✅Thank you, and for more ideas, hit ❤️Like❤️ and 🌟Follow🌟!
⚠️Things can change...
The markets are always changing and even with all these signals, the market changes tend to be strong and fast!!

LTO is ready for massive recoveryLTO finished 80% of projects that are live and working.
Be among the first to buy it ultra cheap as it cheapest in 3 years.
Expected ROI in 60 days: 100%-400%
Good luck traders, don't regret and don't sell this under 0.15$ , feel free to risk up to 0.24$

Short back to 0.0620Struggling to break resistance on 0.08, people want to accumulate more.
There is huge chance LTO is going back to 0.03$-0.05$ where final accumulation will occur in Q1.
After that, plans will get out with all news, and bull-run can start on this token after breaks with strong impulse 0.08-0.12 area heading for 1$ target.

LTO LOOKS BULLISHIt seems that the large diametric wave B is over.
The green range is where we look for a buy/long position.
The targets are marked on the chart.
Closing a daily candle below the invalidation level will violate the analysis.
Hi, dear traders. how are you ? Today we have a viewpoint to BUY/LONG the ICP symbol.
For risk management, please don't forget stop loss and capital management
When we reach the first target, save some profit and then change the stop to entry
Comment if you have any questions
Thank You

LTO Going parabolic too?it's quite amazing how some coins in this period (and LTO too), are trying to break up important barriers like in this idea the 0.15$ level.
Volumes are coming exponentially in the break out direction, and those are sustaining the bullish momentum,
Will that go parabolic? In many cases we have seen many coins with this structure, and pump higher...
Possible potential targets are around 0.30 if a good confirmation will occur!
Good trading!

LTOUSDT.4HFor the LTO/USDT chart provided, here’s a technical analysis:
Timeframe: The 4-hour chart is a good timeframe for spotting short to mid-term trend patterns and potential reversals or continuations.
Ichimoku Cloud: The price is below the Ichimoku Cloud, suggesting a bearish trend. For a bullish reversal, price would need to break above the cloud.
Trendlines: A descending trendline could be drawn connecting the highs, which, if broken, could indicate a potential reversal to the upside.
Resistance Levels (R1): There’s a resistance level marked at around 0.2303 USDT. This level may act as a barrier for price increases, and a breakout above this could suggest bullish momentum.
Support Levels (S1, S2): Support levels are indicated at 0.14177 and 0.1153 USDT. If the price drops, these levels could serve as areas where buying interest might come in to push prices higher.
Relative Strength Index (RSI): The RSI is around 59.93, which is neutral and does not indicate overbought or oversold conditions.
MACD (Moving Average Convergence Divergence): The MACD is slightly below the signal line, indicating bearish momentum. However, the histogram shows reduced negative momentum, suggesting the potential for a bullish crossover.
Price Action: The price appears to be consolidating after a recent uptrend, with a possible bullish flag pattern forming, which could indicate a continuation to the upside if confirmed with a breakout.
Conclusion:
The LTO/USDT pair is in a consolidation phase below key resistance. A bullish flag pattern is potentially forming, which, if confirmed with increased volume and a breakout, could lead to a continuation of the upward trend. The Ichimoku Cloud suggests a bearish bias in the short term, but the MACD hints at possible upward momentum building. Traders should look for a breakout above the descending trendline or the Ichimoku Cloud as a bullish signal, while a drop below support could indicate further declines. Always consider external factors and news that could affect the market and employ risk management in your trading.

LTOUSDT(LTO Network) Daily tf Range Updated till 19-03-24LTOUSDT(LTO Network) Daily timeframe range. another cool continues pump even within bigger mcap taking retrace. for now stuck between 0.1799-0.1266. staying above 0.1266 can fuel it more.
