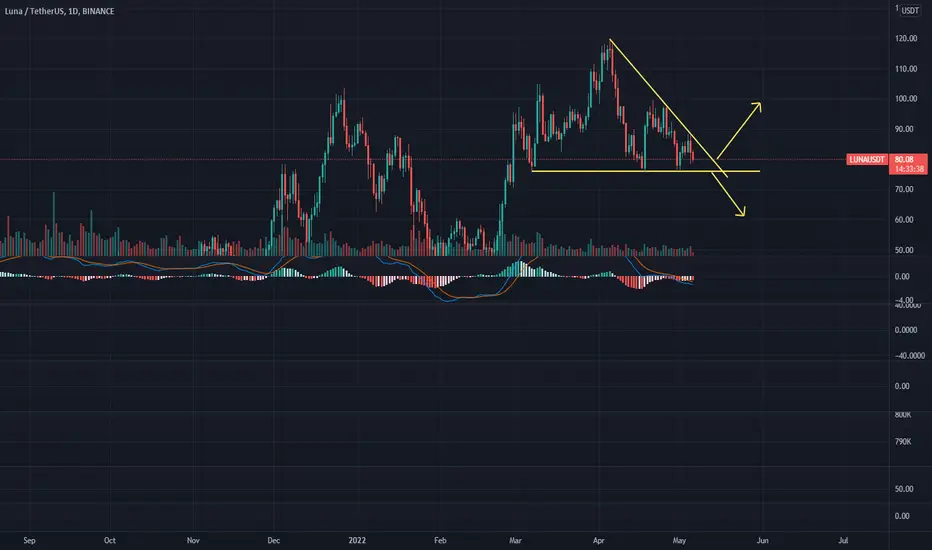
Luna shortLuna is breaking down descending triangle (bearish pattern). Always can retest the support line. Can be a good opportunitty to short.
Don t forget to do Risk management.
LUNA2USDT trade ideas

LUNAUSDTLUNAUSDT LONG
SUPPLY AND DEMAND
SUPPORT AND RESISSTANCE
PRICE ACTION
CANDLESTICK ANALysis
waves analysis
trading
stratgy
ssssssssssssssss

luna going to crash to ground so hard!there is gr8 posibility that luna is going to dump im will w8 till the price come up a little then i will open my short position(first step at 78 and secend at 80 ) my target is 55 .
pls share ur idea with me i love to hear them <3

LUNA $60 insightAfter a clear break below the 50 SMMA(blue dotted moving average), if LUNA doesn’t regain $87, a SHORT down to $60 looks super nice this week.

LUNA daily has tapped my ascending trendline.This is just an update from my phone bc I don’t have my computer, I have been waiting to see if LUNA would wick my trendline, and it did…so for me, it’s a great time to start accumulating… let’s see what will happens at tomorrow nights close around 7-8pm Eastern time…then we can take a look at the weekly chart candle along with the daily…

AoA LUNA ChartHere is my set & forget example exercise for $LUNA of how to cover yourself & play both sides during what we anticipate to be a bearish move but with anticipatory retraces. Giving great detail here so you can also pull fibs & get comfortable with seeing what I see. This is a thought exercise to get used to asking the right questions to build your own setups. Take the time to pause between each question & answer it for yourself. I implore you to do this exercise & try & shoot holes in the analysis. Other than loading up my chart for S/R Zones, do your own analysis THEN review mine. Since writing this post LUNA has moved. My entries are at the bottom. You can copy trade but if you do STILL do your own analysis & make tweaks accordingly. Don’t worry, there’s still plenty of profit taking opportunity.
Fibs alone are not enough to make moves, but they are excellent at finding support/resistance/entries/TPs (NOT STOP LOSSES, this requires MS analysis). BTC PA will play a huge role in if this plays out perfectly (nothings perfect) or partially which is why I've set two different scenarios that play/protect for a 1) retracement up 1st then down, or 2) down then up.
Getting a better understanding of where there is untapped liquidity is also very important & omitted from this exercise — Try & do this yourself. My sentiment is there's more value in MMs ultimately going down than up, so my positions have reflected as such.
1. Why could I be wrong?
2. Why would they want to go up before going down?
I have a little notepad where I jot down levels & prices so my chart doesn't look cluttered & encourage you do the same in the future. For this exercise you can copy/paste this into notes & fill in each question there. I’ll share my numbers at the bottom for you to compare.
Things to look at: Fibs, POC, S/R Zones.
HTF Fibs
Pull Daily HTF Fiib from May 24th to Apr 5th --PAUSE.
- What do you see?
- What fib(s) is a key level for you? Jot it down.
Pull Daily HTF Fib from Dec 27th to Jan 31 -- Hint: Try an external fib. PAUSE.
- What do you see?
- What fib(s) is a key level for you? Jot it down.
- Why would I pull an external fib?
Pull Daily HTF Jan 31st to Apr 5th -- PAUSE.
- What do you see?
- What fib(s) is a key level for you? Jot it down.
1H LTF Fibs:
May 4th to 5th -- hint: Pull a negative fib.
- What do you see?
- What fib(s) is a key level for you? Jot it down.
- Why would I pull a negative fib?
May 4th to 7th --
- What do you see?
- What fib(s) is a key level for you? Jot it down.
May 6th to 7th -- hint: Pull a negative fib.
- What do you see?
- What fib(s) is a key level for you? Jot it down.
- Why would I pull a negative fib?
POCs, Pull Fixed Range VPVR:
Jan 6 - Jan 11th Range — Mark POC VAH/VAL
- POC:
- VAH:
- VAL:
Jan 22 - Feb 24th Range — Mark POC VAH/VAL
- POC:
- VAH:
- VAL:
-
Mar 4 - Mar 8th Range — Mark POC VAH/VAL
- POC:
- VAH:
- VAL:
April 14th - 17th Range — Mark POC VAH/VAL
- POC:
- VAH:
- VAL:
1. What are you noticing about the gap between these ranges?
2. Could you pull Fixed VPVR on other price ranges? Where?
3. Why would certain ranges be useful and others not applicable?
Note: I have 14 POCs marked historically on LUNA — you don’t need to do this at the moment for this move, but marking them has been very helpful for me to see where price will want to jump to next. Only about 3-5 ranges are applicable for this specific move.
S/R Zones 4H — I’ve attached my chart below to speed up this process. You can use this as a template for LUNA moving forward. HIGHLY recommend doing S/R Zones for all coins you’re interested in.
1. What should we be looking for with S/R Zones?
2. Is there confluence between specific zones & fib levels?
3. Is there confluence between zones & POC/VAH/VAL?
5. Based on this information & your own TA / MS Analysis, what would be some good Entries? TPs? SLs?
Longs:
Entries:
TPs:
SL:
Shorts:
Entries:
TPs:
SL:
5. What’s missing from this analysis?
Duracell D Analysis:
HTF Fibs
Pull Daily HTF Fiib from May 24th to Apr 5th --PAUSE.
- What do you see? 0.382 lost with average volume, price could likely retrace to 0.5
- What fib(s) is a key level for you? 0.5 @ $61.63
Pull Daily HTF Fib from Dec 27th to Jan 31 -- Hint: Try an external fib.
- What do you see? Price topped out at the 1.272
- What fib(s) is a key level for you? 0.382 @ $66.62 & 0.236 @ $57.83
- Why would I pull an external fib? Price went external to the fib, no coincidence it finds resistance at the 1.272. External fibs like to retrace internal to the 0.382 & 0.236 on LUNA.
Pull Daily HTF Jan 31st to Apr 5th -- PAUSE.
- What do you see? Price entering the golden pocket — if we weren’t looking at bearish structure all around, this could be a good bounce point for LUNA to continue upwards. 0.786 $59.59 is in line with @brb lowest DCA entry. 0.786 is a big retrace zone for smaller cap alts. LUNA is not one of them, but still worth noting.
- What fib(s) is a key level for you? 0.618 ($72.44) 0.66 ($69.23)
1H LTF Fibs:
May 4th to 5th -- hint: Pull a negative fib.
- What do you see? Support found on -0.618.
- What fib(s) is a key level for you? -0.618 ($72.45) & -1 ($68.70)
- Why would I pull a negative fib? Price in downtrend, likely to go external & negative/expansion fibs are used to find good TP points (or DCA entries).
May 4th to 7th -- hint: Pull a negative fib.
- What do you see? Price not retracing to the .236, downtrend most probable.
- What fib(s) is a key level for you? -0.236 ($68.29)
- Why would I pull a negative fib? Price in downtrend, likely to go external & negative/expansion fibs are used to find good TP points (or DCA entries).
May 6th to 7th -- hint: Pull a negative fib.
- What do you see? Price rejects the 0.236 & breaks 0. Downtrend most probable.
- What fib(s) is a key level for you? 0.618 ($78.48), 0.236 ($74.40), -0.236 ($69.85), -0.618 ($66.18) — If I were to aim for a retrace, the 0.618 is a good zone with confluence.
- Why would I pull a negative fib? Price in downtrend, likely to go external & negative/expansion fibs are used to find good TP points (or DCA entries).
These fib levels are important to me because there is confluence between POC/VAL/VAH & historical S/R Zones.
POCs, Pull Fixed Range VPVR:
Jan 6 - Jan 11th Range — Mark POC VAH/VAL
- POC: $70.10
- VAH: $73.37
- VAL: $68.51
Jan 22 - Feb 24th Range — Mark POC VAH/VAL
- POC: $51.81
- VAH: $57.38
- VAL: $47.98
-
Mar 4 - Mar 8th Range — Mark POC VAH/VAL
- POC: $81.48
- VAH: $85.44
- VAL: $78.89
April 14th - 17th Range — Mark POC VAH/VAL
- POC: $81.48
- VAH: $80.37
- VAL: $81.96
1. What are you noticing about the gap between these ranges? Low Volume on VPVR “thin air,” leads me to believe MMs will want to jump from one range to another to tap liquidity, and essentially blow thru these gaps.
2. Could you pull Fixed VPVR on other price ranges? Where? Other historical ranges between $50s - $74ish
3. Why would certain ranges be useful and others not applicable? @Gwei Zee can talk deeper on this, but my understanding is that $LUNA took a large VC investment in the low $50s. Anything in this range or below would be a fire sale & opportunity for other VCs to come in. This to me means we’ve got massive support in the high 50s. Pulling POC zones above $78 can help come up with HTF targets for long positions.
S/R Zones 4H — I’ve attached my chart below to speed up this process. You can use this as a template for LUNA moving forward. HIGHLY recommend doing S/R Zones for all coins you’re interested in.
1. What should we be looking for with S/R Zones? Confluence between S/R Zones, POCs, VAH/VALs and fib levels to structure where price will gravitate towards & help me find probable entries, TPs, SL.
2. Is there confluence between specific zones & fib levels? Yes
3. Is there confluence between zones & POC/VAH/VAL? Yes
4. Based on this information & your own TA / MS Analysis, what would be some good Entries? TPs? SLs?
Longs: I front run above prices to ensure it gets picked up/TP’d. Entries have been set off confluence between POC/S/R & Fibs
Entries: $72.75, $70.10, $68.95, $66.75, $64.5, $59.2 (don’t have to use all of these)
TPs: $74-$81.4
SL: $55
Shorts: I front run above prices to ensure it gets picked up/TP’d. These shorts are if we retrace before dropping. If we end up dropping & filling the $68.95 long entry, I will cancel these. You can also stack these entries if LUNA starts to nose dive.
Entries: $74, $75.5, $77.21, $78.6, $81.48 (don’t have to use all of these)
TPs: $66.2 - $59.2
SL: $82
5. What’s missing from this analysis? Identifying supply & demand zones. Looking at macro/micro Top Trader Positions, Open Interest on TRDR or other sites.

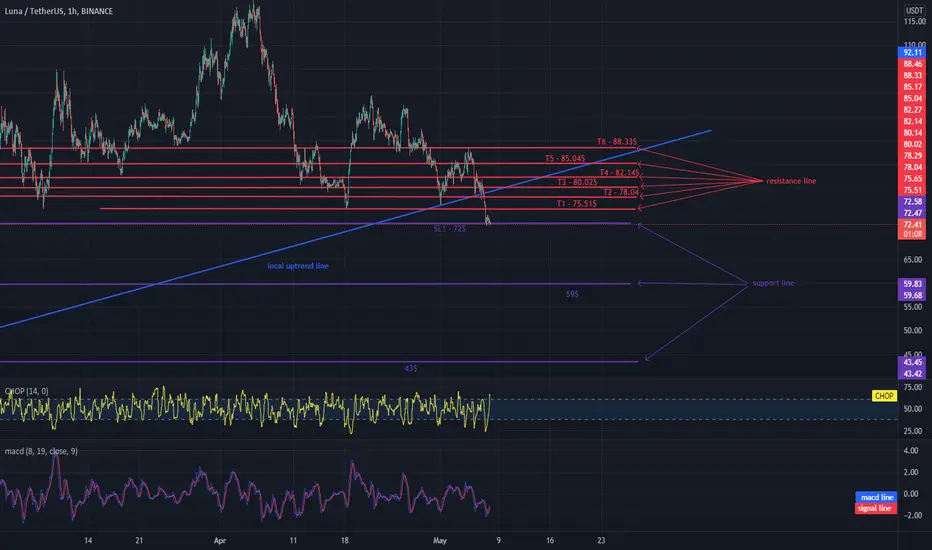
LUNA based on supportHello everyone, let's take a look at the LUNA to USDT chart over the 1 hour timeframe. As you can see, the price has dropped below the uptrend line.
Let's start by marking the support line and as you can see the first stop loss the price is currently basing on is SL1 - $ 72 if the support breaks, the next stop loss to consider is $ 59, and another is $ 43.
Now let's move on to the targets that we can set for the next few hours, as you can see on the chart, the first target is T1 - $ 75.51 and the next ones: T2 - $ 78.04, T3 - $ 80.02, T4 - $ 82.14, T5 - $ 85.04 and T6 - $ 88.33
Looking at the CHOP indicator, we can see that we have a lot of energy in the hourly interval, so it is worth being careful and hedging your stop loss positions.
LUNA 4hLUNA fell to the lower border of the falling channel. The price has formed several bullish divergences - a price rebound to the upper border of the channel is possible

Where to buy LUNAUSD safely ?Almost 3 weeks ago, we warned you that the Lunausdt price was approaching the $95-100 liquidity zone, where a sharp drop could begin, check out the idea below:
As a result, the Lunausd price decreased by -30%.
Do you want to know what might happen next?) So keep reading our idea.
Now the price of LUNAUSDT is approaching the first purchase zone of $64-71, from which will be good a partial set of long positions.
However, it is not necessary to use the entire allocated deposit for the purchase TerraLuna
After all, as we have seen in recent days, the cryptocurrency market may collapse sharply.
Therefore, we consider it a reasonable decision to place part of the orders for the purchase of Luna on the fall below in the liquidity zone $43-46
Well, the medium-term goals for growth are $117 and ideally $210, but about this in our next ideas)
_______________________________
Since 2016 , we have been analyzing and trading the cryptocurrency market.
We transform our knowledge, trading moods and experience into ideas. Each "like under the idea" boosts the level of our happiness by 0.05%. If we help you to be calmer and richer — help us to be happier :)

Time to load some LUNAlunaa is on a big support with 200Ema touching down so a good bounce back is expected.


Luna Usdt Bearish Weekly DivergenceWeekly bearish Divergence in Rsi .
Buying Zone = 76.500 / 54.700
GOOD lUCK :)


LUNA daily chart still looks excellent!LUNA daily chart is still doing great...its sitting in the
consolidation support box and the DeMark 9 is reading
it may of hit bottom...The chart is bullish and the Stoch
RSI and RSI are both bullish...With Luna buying more BTC
to back up their company, they now own more BTC than
TESLA... BIG things happening with this company.

LUNA/USDT 1H FUTURES 06.05.22Hello everyone, if you like the idea, do not forget to support with a like and follow.
Luna/Usdt
long 17x short 17x 😉
Entry Price : 80
Short :
T1 : 71.50 %180
Long :
T1 : 88 %170
📅 06.05.22
📌

Luna trend 4-4hluna has reached the lowest part of this trading range and the trading range can be extended to the bottom of the spike move
trade options
1: seeing pin bar and entry bar for long
2: waiting for a true break in 4h time frame and seeing at least 2 candles breaking the surface of the lowest part of the trading range for entering in a short position

Luna Massive Tank incoming to $40s?Already fell out of the parallel channel.. if it doesnt get back up there soon expect a major tankening to at least $47 unless it crashes with Bitcoin then it can go into the $20s. Either in the last wave 5 or the decline has started

Luna shortPossibly the Luna price is forming inverse Cup And handle Pattern.
Take a look at 4H timeframe.
Potentially it can give us a price near 55 after testing the 77 level from the bottom.
Also Stoh Rsi shows a local downtrend at dayli timeframe.

LUNA LUNAUSD Supply And Demand AnalysisSee the Picture for analysis!
Just drawing out some zones that would of interested me based on my trading style.
thought?

Luna/Tether 1DDue to the recent decline of Bitcoin, if the market is bullish, it is possible for the trend to return and achieve the desired profit.


LUNA FRACTALITY PROJECTIONMy scenario for LUNA. Can price and market cycles be really fractal? Lets find out!

LUNA, triangular shape.The following content is machine translation:
On the daily chart of LUNA, the descending trend line and support are currently forming a triangle pattern. Begin in a tight range, watch for support near 76 and the resistance zone of the downtrend line, bullish above and bearish below.