LUNA/USDT update : 103 resistance to watchLUNA/USDT update : 103 resistance to watch
Previous analysis 7/04/2022 :
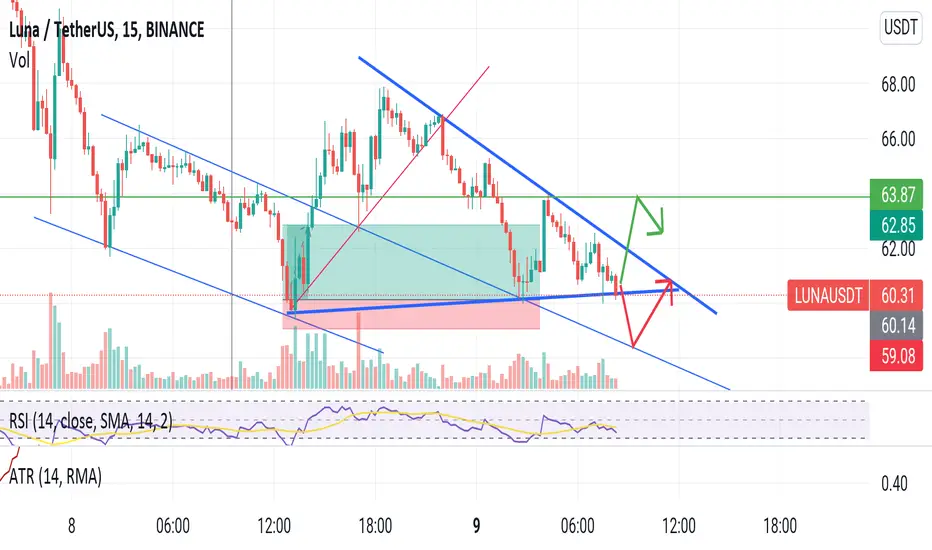
After having broke 91,70 (exhaustion warning) Lune consolidate to 76 before bouncing off. The 50% retracement area has been reached and for now onlt a reintegration of 103 (61,8% Fibo level) would leans towards a direct rise towards the next target (New ATH)
For now a test of 62/63 can't be ignored - the RSI is mixed and the EMA challenged.
Tactical View
To dangerous to short on my opinion, but for the trader who tooked profit around 108 i would wait a confirmation to re-enter, a new drop below 76 will give an opportunity to renter in the long-term trend (Most likely scenario in green)
The important things to understand is : we are drawing a consolidation pattern which will produce a new ATH in the coming weeks... So for long term Holder no reason to sell at the moment - not before 148
Enjoy my friend
LUNAUSDT trade ideas

LUNA/USDT Next Move?Hey Traders,
Brief update about our analysis
Today we are monitoring LUNA/USDT . Yesterday was very active day on the market where price fell 23%. For now LUNA is heading towards the key support level of $52. Once it's there we will get better understanding of what will be happening after that but for now this is our vision of the LUNA
If you like ideas provided by our team you can show us your support by liking and commenting.
Yours Sincerely,
Swallow Team
Disclamer:
We are not financial advisors. The content that we share on this website are for educational purposes and are our own personal opinions.

LUNA (TERRA) short position 🚀Based on the chart, the price has started to dump, and we lost our previous support ✔️
we
expect to see brief correction at least to our lower support area ❌🧨
Please, feel free to ask your question, write it in the comments below, and I will answer.🐋

Terra (LUNA/USDT) on a Crucial Support LevelsWhile the whole crypto market bleeds profusely as the brutal attack on the BTC & ETH price continues, the majority of the altcoins drop heavily. Terra (LUNA) which was once predicted to hit a 3-digit figure, is now drowning in a deep bearish well.
LUNA price currently is testing the crucial uptrend line and may enter a huge bearish trend if it breaks these levels
The price may be rejected at these levels and could slide down below $50 at 0.6 FIB levels to hit $48.67 where-in a rebound may be fast approaching
The rebound may assist the price to regain the levels above the trend line and quickly attain the levels above 0.6 FIB levels around $75

LUNA Short Term ScalpingI think if LUNA can hold the $60 support, it will pump to the $64 and then dump as BTC may go dipper soon!
If nof then it will break the $60 and Will follow the channel untill BTC big dump
#LUNA Breaks Down as Terra Finds Support at $60Past Performance of LUNA
The LUNA coin continues to slip versus the USDT when writing. Although buyers are confident, sellers have been firm. As per the performance in the daily chart, LUNA is within a bear breakout formation as bulls are capped below $80. In the previous trading week, the coin is down 11 percent against the USDT. If sellers press, the token could slide below the immediate support, slumping to Q1 2022 lows.
#Terra Technical Analysis
The primary support is $60, flashing with the 78.6 percent Fibonacci retracement level of the Q1 2022 trade range. In a bear breakout formation, the immediate trend is defined and is southwards. As a result, traders may find entries on every correction towards $80. So far, LUNA bear bars are aligned along the lower BB, suggesting intense selling pressure. The immediate target for sellers stands at $60. However, if there are more profound losses, the coin may contract to retest $45—around Q1 2022 lows in a bear trend continuation. Such a move would unwind the gains of March and April, shaping the medium-term trajectory to solidly favor sellers.
What to Expect from LUNA?
The Terra ecosystem is huge and one of the most liquid. LUNA is pinned by determined sellers at spot rates and may slump below $60, heaping more pressure on optimistic Terra bulls.
Resistance level to watch out for: $80
Support level to watch out for: $60
Disclaimer: Opinions expressed are not investment advice. Do your research.

LUNA to the moon!Hello Traders, currently Luna is bearish but fear not! Luna is about to retest the support. After plummeting down to ~$65, we can expect the price to retrace to about ~$130.

Possible Double BottomWell looks like a small run up will be taking place soon. But don't confuse it for the bottom of the overall trend. Still in bear 🐻 land. May be seeing a corrective wave.

PRZ as Bat pattern at LUNA (Crypto)There's a possibility to buy LUNA around 50-52. There's also a confluence with an AB=CD pattern. Just wait for the price to go to the zone and its price action. Target will be green lines.
Do you hvae any other ideas? Let me know on the comments.

LUNA trend predictionI'm using Fib Trend-based Extension and Trendlines to predict a reversal of LUNA at around $122. It needs to go down to see the EMA 220 (1D).
This price is a crossing of Fib 0.786 and the upper trendline of the parallel channel. Moreover, volume is continously decreasing since it's started the second rally.

LUNAUSDT time for the retracement?The price created a new ATH as I said on the previous analysis and now got a rejection from 1.27 Fibonacci Ext on 120$
The price is testing the new daily support.
How to approach?
The price could have a retracement after the latest bullrun, and retest the 0.5 Fibonacci level or 0.618 on 80$.
so IF and only IF the price is going to lose the support and had a breakout from the rising wedge, According to Plancton's strategy , we can set a nice order
–––––
Keep in mind.
🟣 Purple structure -> Monthly structure.
🔴 Red structure -> Weekly structure.
🔵 Blue structure -> Daily structure.
🟡 Yellow structure -> 4h structure.
–––––
Follow the Shrimp 🦐


Is it possible to see $LUNA dropping to $50 ¿? YES, BUY THE DIP!TERRA $LUNA is an amazing project and they are buying the dips with BTC... WHY DON'T INVEST IN $LUNA??
Price now is cheap, it could drop more so will be great for long term investors!
Also, $LUNA has a nice Staking % and a lot of HODLers with them, we never sell only buy more and more :)
I cannot wait for see $LUNA at $200+ next years.
#DYOR & NOT FINANCIAL ADVICE

LUNA REACHED THE FLOOR OF OUR CHANNEL >_-According to our previous analysis, we expected Luna to reach the bottom of our hypothetical channel, which it did. Now we can wait for candle today so we can enter with more confidence.

LUNA - Top-Down Analysis!Hello TradingView Family / Fellow Traders. This is Richard, as known as theSignalyst.
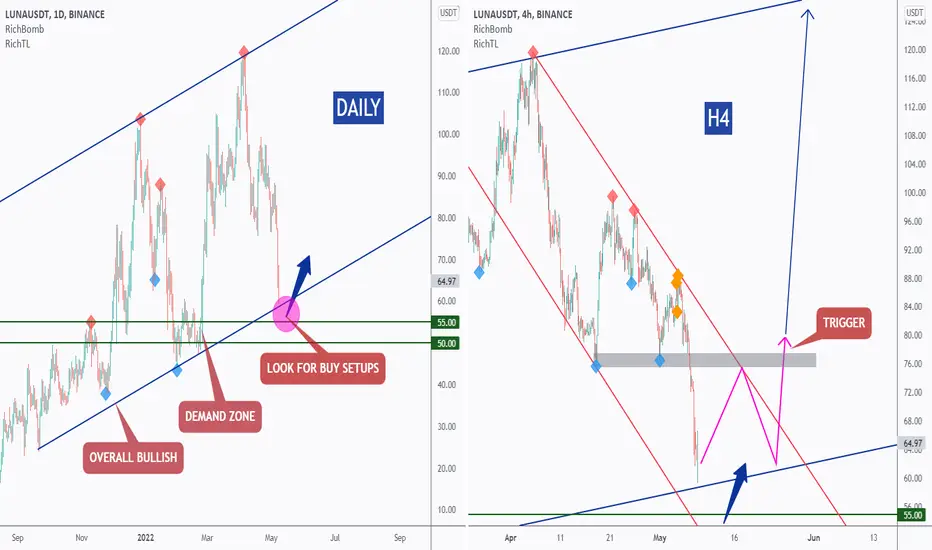
DAILY: Left Chart
LUNA is overall bullish trading inside the blue channels.
Moreover, 50.0 - 55.0 is a strong demand zone .
So the highlighted purple circle is a strong area to look for buy setups as it is the intersection of the green demand and lower blue trendline. (acting as non-horizontal support)
H4: Right Chart
LUNA is forming a channel in red but the upper trendline is not valid yet, so we are waiting for a new swing high to form around it to consider it our trigger swing. (projection in purple)
Trigger => Waiting for that swing to form and then buy after a momentum candle close above it (gray zone)
Meanwhile, until the buy is activated, LUNA can still trade lower inside the demand zone .
Always follow your trading plan regarding entry, risk management, and trade management.
Good luck!
All Strategies Are Good; If Managed Properly!
~Rich
$LUNA - The Way ForwardHEAD AND SHOULDER BEARISH PATTERN SPOTTED.
What does that mean? Bearish Bearish Bearish! We may get to $50 and even lower soon to complete the setup.
But before that, we should expect and plan to catch the next short term rally to $70 possibly.
Entry would be lower time frame after confirming exhaustion.
Don't forget to like and follow for more trading updates and free signals.
#$KC #Meekhill #Meekhillacademy #RICHMMDT

LUNA in May is bearishBroke down from a longterm rising channel, expecting a retest then a dump.
Daily CCI clearly in a downtrend.
Since LUNA is one of the best performing ALTs I expect that all alts will be bearish and BTC.d will rise.


Luna upward trend ???in the daily time frame as can be seen we almost reach the bottom of the channel so typically we expect growth until at least the middle line of the channel 90 $ of course it takes a breath in 70-71 $
⚠⚠⚠ certainly you should consider the BTC actions and fundamentals when Luna touches the bottom of the channel

Game Over for LunaBreaking the trend Line is not good, As this trend line was acting as a major support during uptrend. Next buying range is at $25.

LUNA USDT LONG ideaLong from 58.76
target: 75.50
after a predicted huge sell-off the H&S pattern is complete and should now technically follow the Chanel it has created.

Sell luna The previous trend was falling and now we are seeing fixed floors and lower ceilings. The probability of continuing the falling trend is very high

LUNA daily chart update and showing accumulation zones.LUNA daily chart is still doing great...with this chart update
what we have to look at are the 2 levels of support boxes...
Both RSI's are literally at the floor...As well as RSI has touched
the support line as well. This looks to be a
great start of accumulation zones now more clearly.
With Luna buying more BTC
to back up their company, they now own more BTC than
TESLA... BIG things happening with this company.
