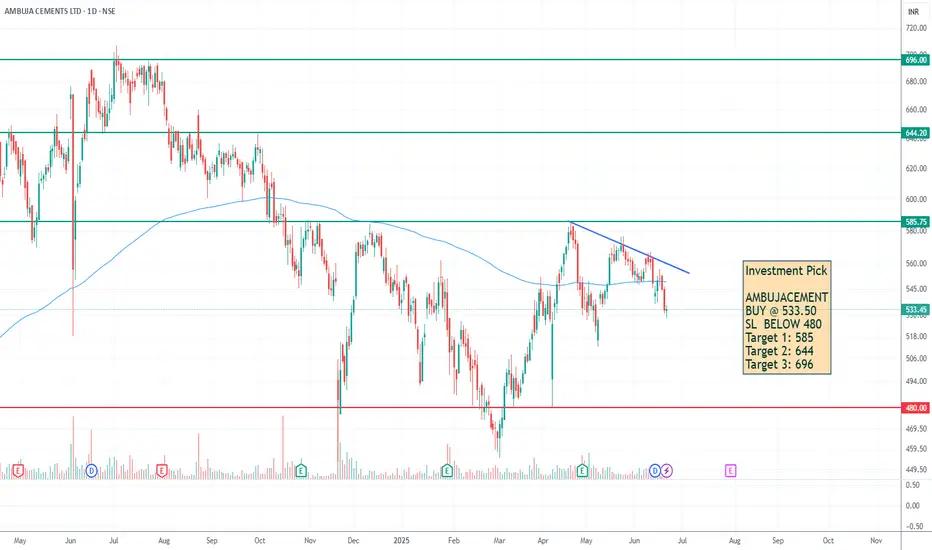
AMBUJA CEMENT - Target 1: 585, Target 2: 644, Target 3: 696Investment Pick
AMBUJACEMENT
BUY @ 533.50
SL BELOW 480
Target 1: 585
Target 2: 644
Target 3: 696
Note: This is for educational purposes. consult your advisor before investing
0.20 USD
492.91 M USD
3.99 B USD
About AMBUJA CEMENTS LTD
Sector
Industry
CEO
Vinod Mohanlal Bahety
Website
Headquarters
Ahmedabad
Founded
1983
FIGI
BBG000DBNNK2
Ambuja Cements Ltd. is a holding company, which engages in the manufacture and sale of clinkers and cement. Its products include Ambuja Cement, Ambuja Kawach, Ambuja Plus, and Ambuja Cool Walls. The company was founded by Suresh Kumar Neotia and Narotam Satyanarayan Sekhsaria in April 1983 and is headquartered in Ahmedabad, India.
Related stocks
AMBUJA CEMENTS:Likely Golden Cross over -Daily chartAMBUJA CEMENTS: Trading above all its Daily Exp Moving averages ,In daily chart theres a likely Golden Cross over -20DEMA Vs all other DEMAS, increase in volume suggests a move towards 600 followed by 624,shall target these numbers by keeping suitable SL(For educational purpose only)

AMBUJA CEMENT - LONGNSE:AMBUJACEM Weekly accumulation with head shoulder formation . macd crossing upward exactly at location.

AMBUJACEM : Ready for a Move ahead!🚀 Swing Trade Levels & Key Zones 💹
📅 Date: February 5, 2025
💰 Current Price: ₹513.70 (+18.55 | +3.75% )
📊 Ticker: NSE:AMBUJACEM
🔹 Key Levels to Watch:
High: ₹520.00
Low: ₹490.15
Open: ₹495.20
Close: ₹513.70
📌 Annotated Zones & Key Demand Areas:
🟢 Demand Zone (Extended Retra

Ambuja cement bullish, Daily candle close 10,20 day ema weekly positive ,
If tomorrow 2hr candle positive ,then take trade 540sl
Target 570 580,

Ambuja Cement:Since broader market is negative, all the major stock recover slowly. Wait for 450 to 460 level (61.8% fibb level).

Plan for 29th October 2024Nifty future and banknifty future analysis and intraday plan in kannada.
Result analysis.
This video is for information/education purpose only. you are 100% responsible for any actions you take by reading/viewing this post.
please consult your financial advisor before taking any action.
----V

AMBUJACEM NSE:AMBUJACEM
Reverse from lower level
support place at 580
above 595
good for swing above 595
RSI(hrly)>40


AMBUJA CEMENTS LTD S/R Support and Resistance Levels:
Support Levels: These are price points (green line/shade) where a downward trend may be halted due to a concentration of buying interest. Imagine them as a safety net where buyers step in, preventing further decline.
Resistance Levels: Conversely, resistance levels (re

See all ideas
Summarizing what the indicators are suggesting.
Oscillators
Neutral
SellBuy
Strong sellStrong buy
Strong sellSellNeutralBuyStrong buy
Oscillators
Neutral
SellBuy
Strong sellStrong buy
Strong sellSellNeutralBuyStrong buy
Summary
Neutral
SellBuy
Strong sellStrong buy
Strong sellSellNeutralBuyStrong buy
Summary
Neutral
SellBuy
Strong sellStrong buy
Strong sellSellNeutralBuyStrong buy
Summary
Neutral
SellBuy
Strong sellStrong buy
Strong sellSellNeutralBuyStrong buy
Moving Averages
Neutral
SellBuy
Strong sellStrong buy
Strong sellSellNeutralBuyStrong buy
Moving Averages
Neutral
SellBuy
Strong sellStrong buy
Strong sellSellNeutralBuyStrong buy
Displays a symbol's price movements over previous years to identify recurring trends.