FOR SWING TRADE HOLD 3-4 DAYS Cup and Handle Breakout Pattern in AMBUJACEM
Book profits within the first 30 minutes of the market opening
- Try to exit by taking 8-10% profit of each trade
- SL can be taken when the 5/15 min candle closes below 44EMA
Now, why do I prefer swing trades? The primary reason is that I have observed that 90% of the stocks give most of the movement in just 3-4 days and the rest of the time they either consolidate or fall
CMP- 585
Target Price 615
AMCEM trade ideas

AMBUJA CEMENTS - Fresh ATH closingAMBUJA CEMENT - Update
Closed above the supply zone. One can aim for the targets of 600 & 625, with a SL of 560.


AMBUJA CEMENT AMBUJA CEMENT - Update
Posted on 446. Gave a massive rally.
Currently, forming a rounding bottom.
A daily close above 580, will invite another 30% target.
Maintain 8% SL.

AMBUJA - The Cash MachineAmbuja cement broke out of ascending triangle pattern with good volumes also happens to b multiple resistance zone.
Could be bought with mentioned stoploss & target

Ambuja Cements Buy Alert Ambuja Cements chart
Daily Timeframe
RS (55 days) is positive and its breaking out 0.4 value. Can go till 0.8-1.
RS above 63 EMA also.
Immediate Target is recent high.


Short AMBUJA CEMENT with 1:17 RRAmbuja cement is going to fall near about 17% and the stop loss is near to 1% only.
Best time to get the maximum reward.
These types of moves generally come to notice with the ELLIOTT WAVE THEORY, as in this case:
Ambuja cement from its high made wave A sharp and wave B triangle. Wave C is about to come, and if we see wave C near about equal to wave A, the reward is maximum.
Also, wave 5 is extended towards a time high and should be retracted. Half of wave 5 is already retraced and half is left which should be retraced by wave C.
The stop loss is 524 and the target is 426.
Happy trading, guys.

Sell Ambuja CementThough the market seems high still i want to bet on Sell for Ambja Cement as it as touched its 500 resistance multiple times, and it seems it will break a candle pattern

Ascendign channel - Ambujacement Ascending channel breakout above 528
Please follow strict risk rewards and stop loss for capital protection..
Thanks,
Vichithra

Ambuja CementAmbuja Cement made inverted head n shoulder on smaller time frame(15 min) with good volumes.
Could be bought with mentioned stoploss & targets.

Ambuja Cement: breakout candidateAmbuja cement has given a strong breakout on daily charts. Keep it on your radar!

#Ambuja Cement#Ambuja Cement retesting break out levels
CMP 500 keep sl 475
Swing/Long term investment idea

ambujaThe second wave correction are going on and should finish soon. the third wave can be shorted in sept expiry. stock is in FNO BAN so watch out. all the best.


AMBUJA CEMENTS long, Swing tradingAMBUJA CEMENTS broke resistance trendline, it has not yet closed abvoe 390, can long once it closes above 392
Long above 392, targets are 400, 420, 440, 460, 500+
SL 370.
-Saptarish Trading.

AMBBUJACEM Short term Analysis Ambuja Cements look suitable for swing trade. all the levels are marked on the chart. target last swing point.

Long ambuja cementLong Ambuja Cement after the BO of Resistance area after the 415 . Target 415-450 with SL of 405. Volume & RSI showing strength. Good R:R ratio.
This is for your educational purpose only

Ambuja Cement This stock has completed 4th wave on daily time frame, and now possibly we are in 5th wave, once resistance trendline is broken then it would be a good trigger point to go long, stock had reached that trendline and currently trying to break, once it's broken, then bulls can take charge, also trend indicators and wave counts are suggesting to go long.
Overall wave structure on daily time frame
Macd in daily positive crossover and Uptick and also above zero line
Macd in weekly positive crossover and Uptick and also above zero line
RSI trendline breakout on daily time frame, uptick and also above 60
Price pushing upper bollinger band to open more upside
RK's Mass psychological Cloud buy activated
Dmi adx also positive on daily time frame
Disclaimer
I am not sebi registered analyst
My studies are Educational purpose only
Consult with your Financial advisor before trading or investing

breakout of resistance.stock is ready to break its long term resistance. also supporting is a bull flag pattern.
entry at 374
target 410.

Ambuja cement Breakout given and in consolidation phase for further up, can buy at current price target is upper trend line and SL is lower trend line or can be TS (Blue line) at ichimoku

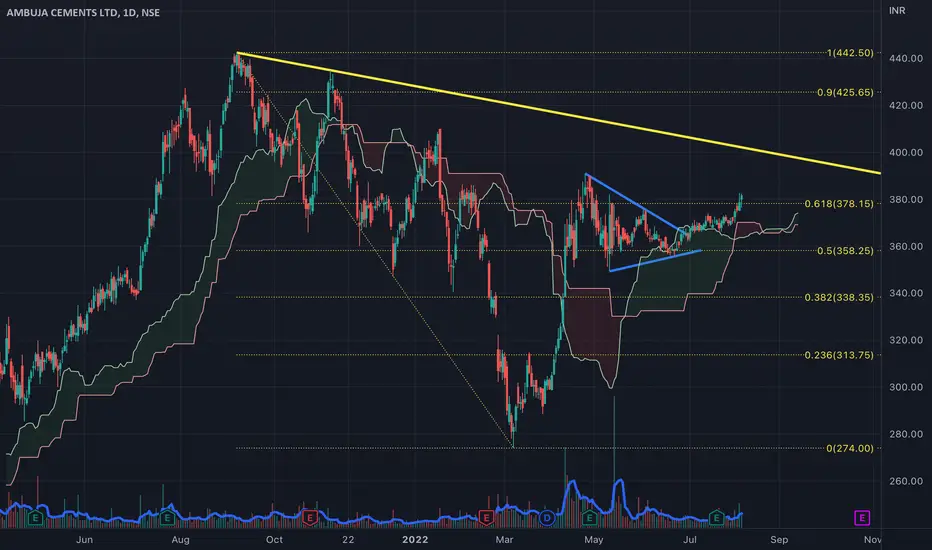
Ambuja Cements eyes Rs. 400 Ambuja cement daily chart shows:
1. Firm close above the 61.8% fib retracement hurdle, the so-called golden ratio, marking a bullish follow-through to the symmetrical triangle breakout confirmed at the end of June.
2. Price well above the Ichimoku cloud.
3. 5-day moving average beginning to trend up.
Further, monthly chart shows 5,10SMA bull cross.
The stock appears on track to test descending trendline resistance around Rs. 400.
Trade: Buy around 380 target 400 stops under 375