Cipla Trade on 19/04/2021CNXPHARMA stocks are in uptrend. Also the ascending triangle pattern shows the bullishness in the stock. If it is broken with very good volume it is good to trade it on the long side. Also provided that if RSI is rising above 70, which shows the good strength, it will a good one to trade. Consider this an analysis and not as a call. This is only for EDUCATIONAL PURPOSE.
CIPLA trade ideas


Cipla Has given a Daily Channel BreakoutCan BUY CIPLA for a TGT of 1000 it has given a Breakout on Daily Charts


Long CIPLA, breaking out of rectangleCipla looks to be in a rectangle. If breaks it'll be 900+ in no time.


Box breakout Stock Analysis: Cipla has broken the box looks good buy around 770 for conservative entry for the target given on the chart on coming days.
Let's see.
Happy Investing!

CIPLA LTD 4HRCONFLUENCE OF Daily & 4HR Bearish shark STRONG zone
VERTICAL DOTTED LINE is Ultra high volume up bars - trap of Smart Money , Higher volume- Professionals are selling into the public buying
SET UP BECOMES VALID ONLY when RSI is below 70 and IF Price breaks ULTRA HIGH VOLUME Candle LOW &
Within 3-5 price bars need the confirmation from a BEARISH CANDLE with LOW VOLUMES & with NO DEMAND l.e place for short
POTENTIAL SELL

CIPLA LTD DAILYBearish SHARK
VERTICAL DOTTED LINE is Ultra high volume up bars - trap of Smart Money , Higher volume- Professionals are selling into the public buying
SET UP BECOMES VALID ONLY when RSI is below 70 and IF Price breaks ULTRA HIGH VOLUME Candle LOW &
Within 3-5 price bars need the confirmation from a BEARISH CANDLE with LOW VOLUMES & with NO DEMAND l.e place for short
POTENTIAL SELL


20-50MA crossover stratergyif market goes bullish and close above high of last wave,than go for a buy. (20-50MA crossover).


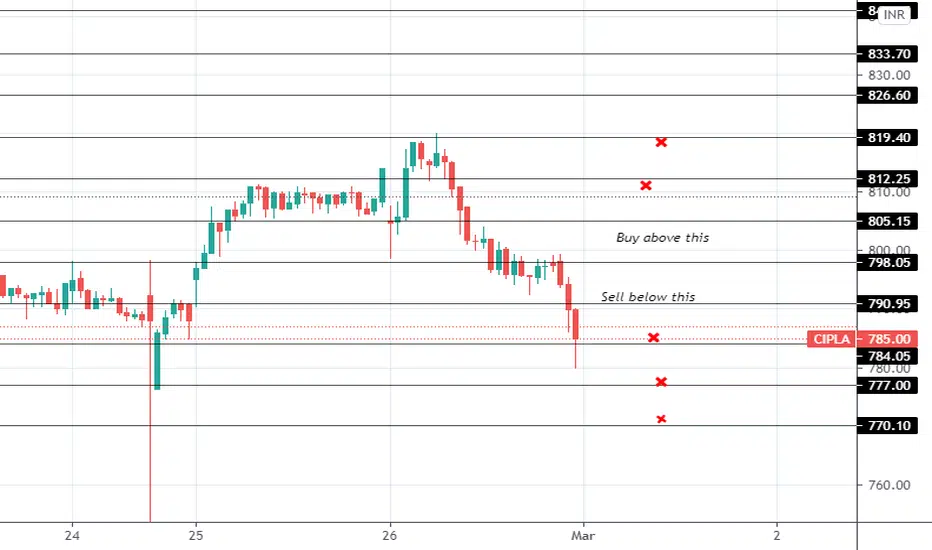
Cipla trend analysisCipla is moving in the down channel so we can long above 800 with TGT 860-900/stop-loss be 778 & short below 780 TGT will be 720-650/stop-loss will be 805

Cipla rangebound for Apr ExpiryCipla seems to be in range between 705 and 820 can sell strangle for Apr expiry


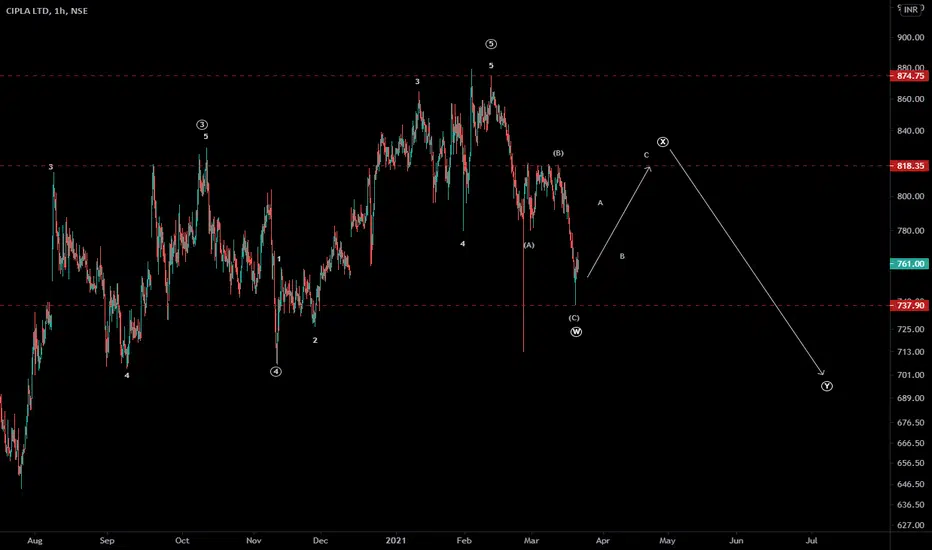
Cipla - Elliott wave analysis - ABC as (X) wave in progress It has completed impulse at last orthodox top and dropped in ABC zigzag down. So the next move would a choppy bounce of (X) wave in complex correction cycle. Wait for A wave bounce to confirm the start of (X) wave for reference. When (X) wave will finish, it start dropping down again in (Y) wave.

Cipla ltdAll key levels are mentioned in chart
which really works as supports as well as resistances
Disclaimer
I am not sebi registered analyst
My studies are Educational purpose only
Please consult with your Financial advisor before trading or investing

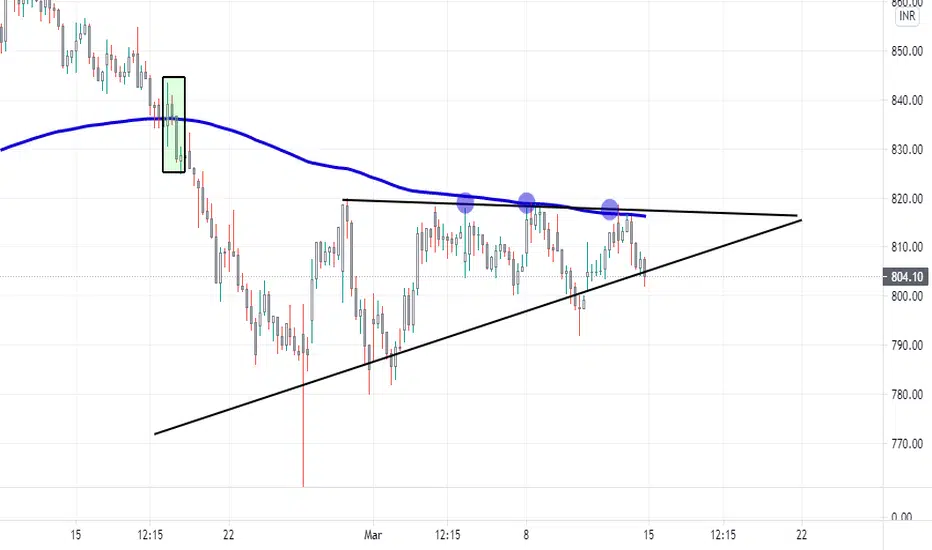
CiplaOn 1 hr time frame
1. Broken 200 EMA on 18th Feb.
2. Price is getting rejected at 200 EMA (marked by blue circles).
3. Currently Cipla is range bound (marked). Any break on lower side will confirm the previous break of 200 EMA and will continue to fall.
This is just for an educational purpose.