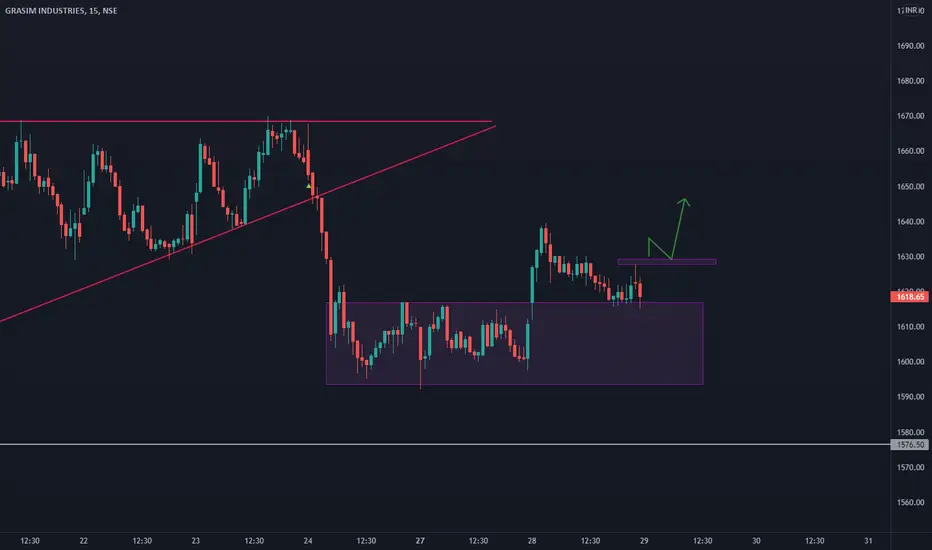
GRASIMonce it crosses the resistance, go for long
on friday there is huge volume on bullish side
So wait for price action and enter the trade
GRA99 trade ideas

Bullish View for GrasimGrasim will remain bullish above the 1595 level. So, consider every dip a buying opportunity. Now the resistance level of 1720 has shifted to the 1870 level after the breakout in the previous trading session with a good volume. The level of 1870 is 61.8% of Fib Extension and Weekly Upper Bollinger Band as well. The level from 1870 to 1925 is a Potential Reversal Zone.
According to the Multi timeframe Bollinger Band analysis, the price has been trading above the weekly 20 SMA (WMBB) and there is a bullish crossover of moving averages near to WMBB which is considered an area of confluence.
Hello Trader. Above is purely my opinion. It doesn't mean that you need to trade accordingly. Please note that I'm not Sebi registered advisor or technical analyst. Trade on your own conviction and please consult your advisor before investing.

GRASIM ::: BULLISH :::DATE: 03 JAN 2022
INSTRUMENT: GRASIM
TREND: BUY
TYPE: POSITIONAL.
TIME FRAME: DAY
CMP: 1661.60
BUY ABOVE: 1678
STOP LOSS: 1616
TGT 01: 1698.3
TGT 02: 1725.6
EXTREME TGT: 1861.65
RISK DISCLOSURE:
We are not S E B I registered analysts. VIEWS EXPRESSED HERE ARE FOR OUR RECORD PURPOSES ONLY. Please consult your personal financial advisor before investing. We are not responsible for your profits/losses whatsoever.


GrasimGrasim is trading in a range & now its ready to break 50% retracement of this current range on th upside,
Buy above 1718 sloss 1694 tgt 1743 intraday.

grasim time frame 30M#bitcoinminning #investingtips #forex #stockmarketnews #wealth #invest #pips #stocks #stockstowatch #investing#dividends #dividendstocks #dividendkings #stockmarket #stocks #valueinvesting #passiveincome #investment #investors #investingtips#wallstreet #finances #passiveincomestream #cashflow #longterminvesting #stockexchange #stocktrading #investingforbeginners #makingmoney #dividendinvesting#dividendincome #nasdaq #compoundinterest #dividend #valueinvestor #compounding #dividendgrowthinvesting #dividendclubdo #cash #dollars#financialfreedom #money #bitcoins #success #millionaire #investing #cashcash #cashslave #casharmy #cashmoney


GRASIMGrasim is consolidating near support zone in both daily and weekly charts. Good to keep on watchlist and check for reversal from support towards 1892
Disclaimer:
I am not a SEBI registered analyst
My views are for educational purposes only.
Please consult with your Financial advisor before trading or investing


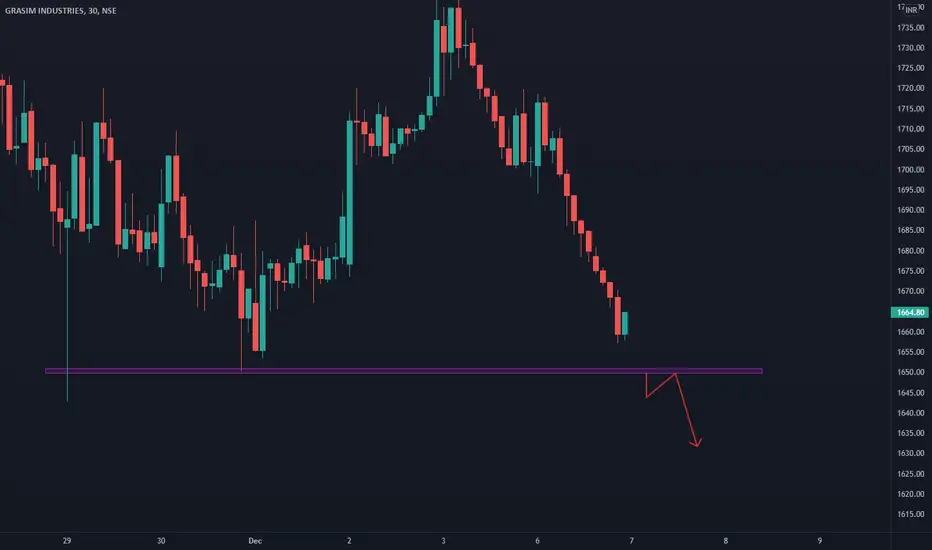
Sell on rise with SL 1770pattern: correction (wave A & B looks completed)
upcoming potential: wave (C)
Fib: green- retracement, red: projections

GRASIM GRASIM - Demand from channel bottom.
Watch how the stock is taking constant support at 21 ema.
Seems good to make it to channel top.


GRASIM 7th Dec PredictionGRASIM 7th Dec Prediction on the basis of Technical Analysis & Price Action.
This is only for education purpose.


GRASIM - holding fortSwing buy in Grasim - spinning top at bottom.
Entry : 1800
SL : 1750
Target : 1900
RR : 1:2

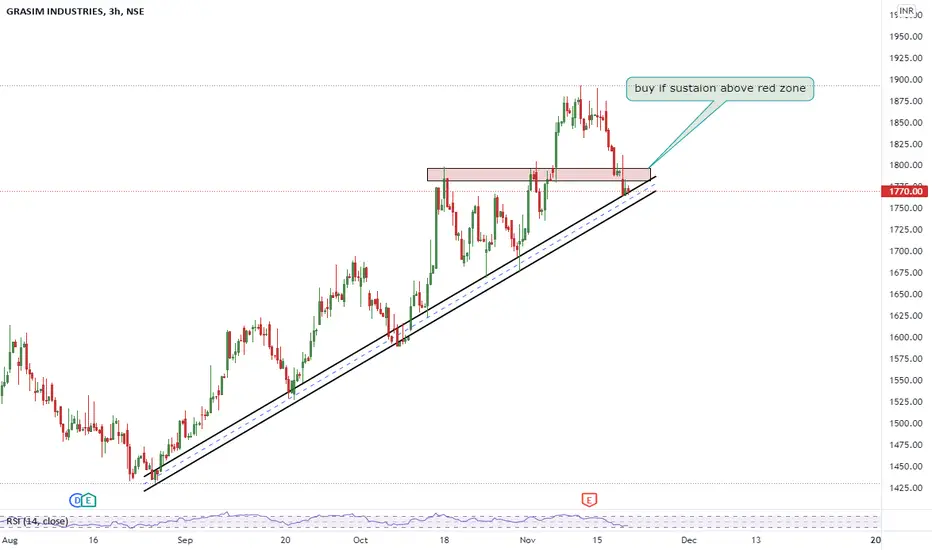
LongGrasim has taken support on Channel line. now from here it can give upward move. Target will be 1965 SL 1750 but 1670 will be safer.

GRASIMNSE:GRASIM
Please note that we are not a SEBI Registered Investor Adviser/PMS/ Broking House.
All the contents over here are for educational purposes only and are not investment advice or recommendations
offered to any person(s) with respect to the purchase or sale of the stocks / futures and options.
You are also requested to apply your prudence and consult your advisers in case you choose to act on
any such content available as WE claims no responsibilities for any of your actions or any outcome of
such action

grasim seams reached ressitance with double top in hourly TFprice trending its all time high made double top in 1hr time frame may retrace back to trendline and kiss Fibonachi level 0.236 if we see bullish candle with volume at trendline and support in RSI 60 we have to go long now this is not time to trade this script (anyhow someone swear to trade they can short with target 1785) :)

