[Positional] India Cements ShortSell below low of friday. SL day high or thursday high SL
Short below 120.55
SL 124.55/126.3 (Final SL)
T 116.5,112,106
INC05 trade ideas


Time to make moves?It's been chilling for a month since 26th of May when it started its downward movement, looks to me as if a big flag is being painted on the daily with the 50 day moving up to offer support around 115 which i was hopeful for a refill.
Looks like its forming this pattern and is ready to move again .
Intra day hop off around 132.75 since its fairly busy there however i recon we move fast to 165 from here on .
125.55 right now and with the 200 day at 118 on the monthly i recon its an awesome R/R.
please check out earlier HTF graph for macro outlook
Cheers!

India Cements - Pennant PatternNSE:INDIACEM is currently forming Pennant Pattern.
The stock is in uptrend. In case of breakdown, that can be used to buy the dip.

INDIA CEMENT - come fill me expecting a pull back to 115 zone will fill up if that happens for the next leg up to 161 .
Nothing much to comment , golden cross happening , just feel we are reaching the I'm a genius and can make money in the market stage with people so raise your stops once in profit.
Risk Free trade if you wanna hodl....
Cheers!


India Cement Head and Shoulder(Short)Technical Analysis
India Cement is about to make a complete right shoulder toward neckline which is a final stage of head and shoulder pattern. once it would break the neckline of 66-67 rupees, we can see a huge break down of the stock.
Fundamental Analysis
Even though India Cements aims to reduce gross debt by ₹200-250 crore in the current quarter, its repayment liability for fiscal year 2020 is estimated at ₹3,750 crore.
Best short contender. Short time fall is 115 and then big fall once it cross 66, that big fall would take long time to hit.


Trading Idea : Buy India Cements Ltd.NSE:INDIACEM has made higher top & higher bottom after long range bound consolidation on weekly chart. Stock has crossed and currently trading above range bound consolidation zone. Stock is also trading above all key moving averages and RSI and ADX are also showing strength on weekly chart.
We are recommending strong Buy around 114-119 with Stop Loss below 97 (Closing Basic) for Target of 155 in next 8-10 weeks.
dhnwealthcare.com


799. End of abc at 72 as false low; Entry point at false low Ideal entry entry point after forming false low or at support .
Sl compulsory
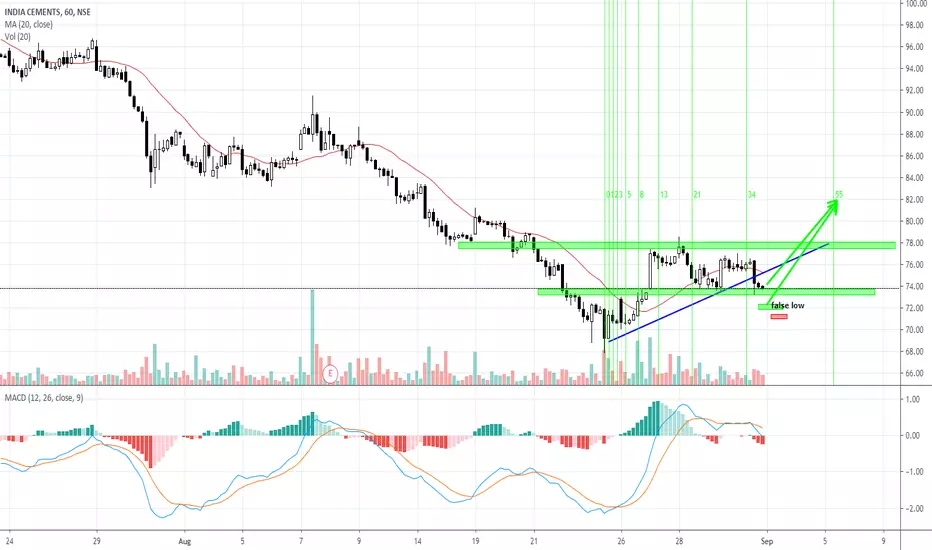
INDIA CEMENTS 60 MINS TIME FRAME WAITING FOR PRICES TO TEST THE ENTRY ZONE. SELL SETUP :)
KEEP IT SIMPLE, KEEP IT UNIQUE :)
HAPPY TRADING, HAPPY PROFIT MAKING :)
NOTE: MY VIEW ONLY....


coming weeks are green for india cement....buy at 111coming weeks are green for india cement....buy at 111........happy investing

INDIACEM SHORT TERM SHORT OPPORTUNITYPossible BAT pattern formation at a strong supply zone. Though the sector is strong this trade looks promising as the Risk Reward is favourable to take a bet.
FOR EDUCATIONAL PURPOSES.


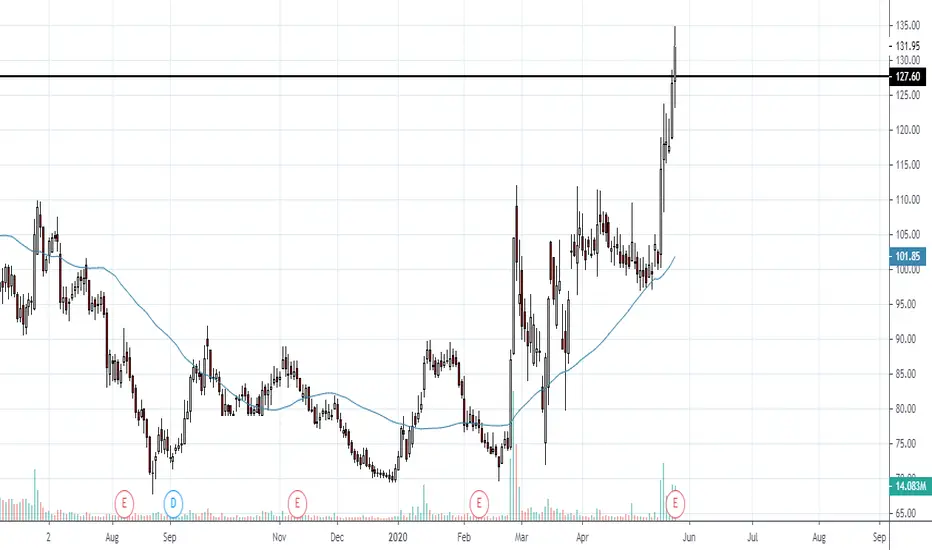
Buy INDIA CEMENTSScenarios have shown a reversal of trend. Divergence coming in with braking of resistance may have triggered a bullish momentum now. Currently it seems the stock has made a slight correction after having shown a minor bullish rally and this correction should now come to an end with fresh bullish pattern again forming at key Fibonacci level of 0.618 which happens to be around 108. 108 has been a key level in the past also which indicates it may again act as support and stock may resume it's freshly initiated bull move. A decisive close above 120 may provide for even higher targets of around 130.

#INDIACEMBottom is confirmed
Reversal confirmation awaited
Support at Gap
Awaited Alignment
Must cross 125 with strength (Long Fibo) for target 145

