ITC trade ideas
ITC🔷 ITC Trade Setup Summary
Key Element Details
Trade Type BUY (Long)
Entry Price ₹416
Stop Loss ₹380
Target Price ₹604
Risk ₹36
Reward ₹188
Risk-Reward 5.2 : 1
Last High ₹498
Last Low ₹392
✅ Trade is trend-aligned across all timeframes.
📌 Entry at ₹416 is at the top of a demand cluster (monthly to intraday) – ideal for breakout continuation.
🔷 Setup Logic
✅ All trends UP: From Yearly down to 60 min – strong alignment.
📈 Entry sits just above a dense demand cluster (₹380–₹416) – smart and safe.
🛡️ Stop Loss (₹380) is protected by all demand zones.
🎯 Target (₹604) is realistic long-term, breaking past the previous high of ₹498.
🔷 Strategy Recap
Action Price Reason
BUY ₹416 Breakout above demand zones (DMIP)
SL ₹380 Below demand cluster (safe risk)
Target ₹604 Swing target, above previous high
🔷 Verdict
✅ Good RR (5.2:1) — even a 30–40% move to target gives excellent profit.
✅ Ideal for swing or positional traders.
⚠️ Watch for price consolidation around ₹416–₹420 before breakout.
🔷 Multi-Timeframe Demand Zone Breakdown
Timeframe Zone Type Zone Range (₹) Avg Price Remarks
Yearly BUFL 340 – 307 324 Strong long-term demand base
Half-Yearly BUFL 340 – 307 324 Matches yearly zone
Quarterly BUFL 372 – 357 365 Consolidation before breakout
Monthly DMIP 416 – 380 398 Entry sits on top of this zone
Weekly DMIP + Swap 416 – 380 398 Strong structure at entry area
Daily DMIP 402 – 380 391 Repeated buying interest
Intraday DMIP 407 – 394 401 Confirming strong near-term demand
ITC Ltd – Breakout Watch!ITC has been consolidating between ₹424–₹438 for weeks. Today, it’s testing the upper range, signaling a possible breakout with a target near ₹450–₹452.
🔹 Resistance: ₹438
🔹 Support: ₹424
🔹 Volume: 16.18M (rising)
A close above ₹439 with strong volume could confirm the breakout. Watch closely — this move could offer a quick swing opportunity! ⚡
Ye Chart Kuch Kehta Hai (ITC Ltd)ITC making consecutive 3 months higher high, early sign of cup formation and target is for cup breaking out point as golden ration of Fib. retracement. FMCG Sector turn-around and poised for growth. Multiple sign clearly indicates that ITC is picture perfect chart for growth.
Low cheat option, may turn around and ready for cup formation.
ITC Ltd view for Intraday 16th May #ITC ITC Ltd view for Intraday 16th May #ITC
Resistance 435 Watching above 436 for upside momentum.
Support area 425 Below 430 ignoring upside momentum for intraday
Watching below 424 for downside movement...
Above 430 ignoring downside move for intraday
Charts for Educational purposes only.
Please follow strict stop loss and risk reward if you follow the level.
Thanks,
V Trade Point
ITC Ltd view for Intraday 15th May #ITC ITC Ltd view for Intraday 15th May #ITC
Resistance 435 Watching above 436 for upside momentum.
Support area 425 Below 430 ignoring upside momentum for intraday
Watching below 424 for downside movement...
Above 430 ignoring downside move for intraday
Charts for Educational purposes only.
Please follow strict stop loss and risk reward if you follow the level.
Thanks,
V Trade Point
ITC Ltd view for Intraday 23rd April #ITC ITC Ltd view for Intraday 23rd April #ITC
Resistance 435 Watching above 436 for upside movement...
Support area 428-430 Below 430 ignoring upside momentum for intraday
Watching below 428 for downside movement...
Above 435 ignoring downside move for intraday
Charts for Educational purposes only.
Please follow strict stop loss and risk reward if you follow the level.
Thanks,
V Trade Point
ITC Ltd view for Intraday 21ST April #ITCITC Ltd view for Intraday 21ST April #ITC
Resistance 429-430 Watching above 430 for upside movement...
Support area 420 Below 425 ignoring upside momentum for intraday
Watching below 419 for downside movement...
Above 425 ignoring downside move for intraday
Charts for Educational purposes only.
Please follow strict stop loss and risk reward if you follow the level.
Thanks,
V Trade Point
#ITC Demand Zone An ITC Demand Zone refers to a specific price level or area on a chart where the buying interest in ITC Limited (a leading Indian conglomerate with businesses in FMCG, hotels, paperboards, packaging, agri-business, and IT) is significantly strong. This concept is used in technical analysis to identify key levels where the price of ITC's stock might find support and reverse upward. Demand zones are critical for traders looking to enter long positions at favorable prices.
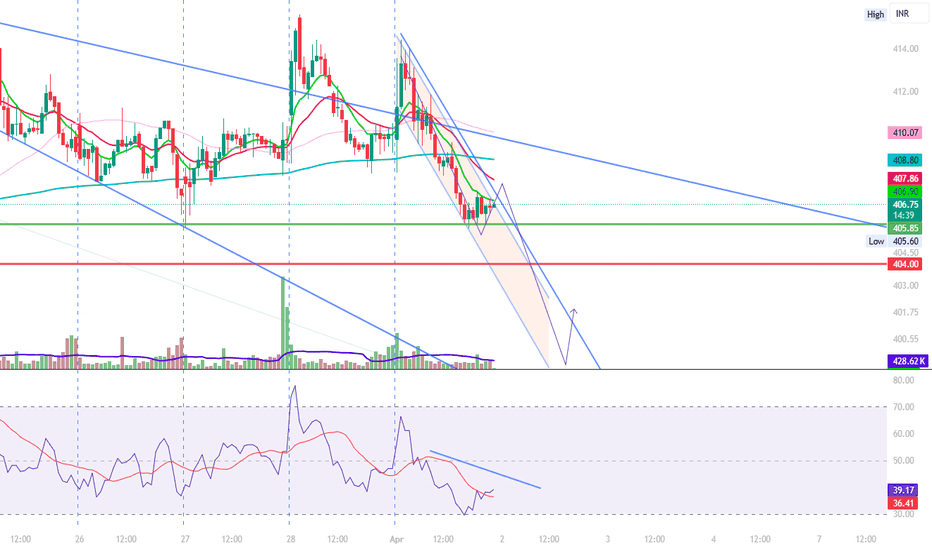
ITC | SHORT | STBTFurther to my previous Swing Short Trade given on ITC based on the Daily Charts, here is a Trade on the short side for those looking to take entries based on the Hourly chart.
ITC can be shorted for an STBT trade since it has rejected yesterdays low and is also unable to sustain the weekly pivot.
Target - 432
SL - Todays high


