What's Going On With ITC?NSE:ITC has had a recent de-merger which let to a price decline of more than 5% last week. However the stock was already in a retracement phase as seen on weekly timeframe and it went down all the way to 430 rupees which was the 71.8% retracement level.
The current BB range is 400 to 500 which is a 20-25% volatility range in the 3 Standard Deviations. The price is almost in middle of it. It is above the 21 EMA which serves as the basis.
The RSI is above 50 and just above the MA.
Anything can happen. It can fall down all the way to 400 or it can shoot up all the way to 500 in just a couple of days.
I have a buy position already but I need to be cautious and continuously monitor it as the volatility is high.
It would be better to monitor it on an hourly basis and focus on the RSI Channel.
Once its broken, We can move to a daily time frame and make hold vs exit decision.
ITC trade ideas

ITC : In a Buy territory,managed to close above Supertrend today
ITC : In a Buy territory,managed to close above Supertrend today although very near to the resistance of 500. Important resistance levels to watch for are 500 and 530 .
MACD is positive .
The only things that concern me are:
The size of the today's Green candle and nearby resistances .
( Not a Buy / Sell Recommendation
Do your own due diligence ,Market is subject to risks, This is my own view and for learning only .)

Green Flag to ITC !!??!!Looks like ITC has done its consolidation and corrected. Now its turning up !!

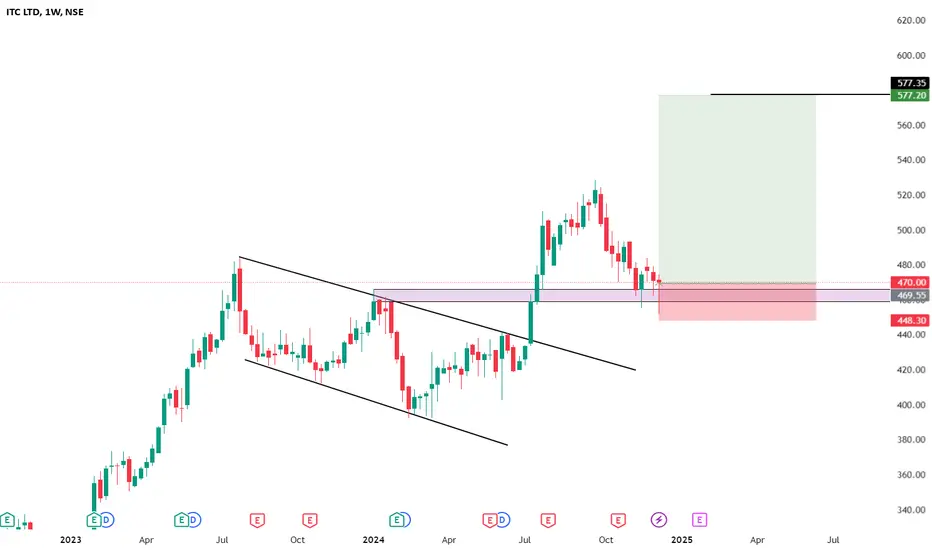
ITC LTD - WEELKY TF ANALYSISITC stock had a bullish flag pattern breakout some months ago, which resulted in a 15% profit. Now, the stock price has returned to the demand zone (the price range where it previously faced supply). From this range, there is a good chance the stock price could rise. In my view, this current price range looks like a good opportunity to buy.
ITC IN BUYItc is fundamental too strong and in technical its in fibo 50% so can buy @ 468 in technical
in fundamental 400
so buy 468 in here
next buy below 400
TRG 550-650
1-2 Year Holding

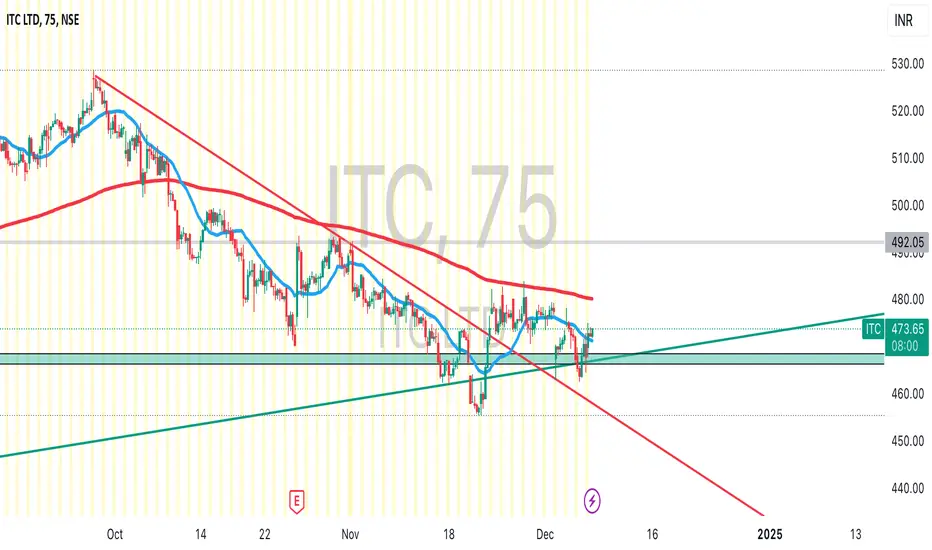
ITC | Long | SwingITC looking good for an up move.
Price is consolidating above the 200 DEMA and almost below the Monthly Pivot and Weekly Pivot.
Price has gone back above the Weekly support after breaking it which indicates a sign of Buyers stepping in.
A potential move up to 492 level could be expected.
ITC Ltd view for Intraday 6th Dec #ITC ITC Ltd view for Intraday 6th Dec #ITC
Resistance 470. Watching above 471 for upside movement...
Support area 460 Below 465 ignoring upside momentum for intraday
Support 460 Watching below 459 for downside movement...
Resistance area 470
Above 465 ignoring downside move for intraday
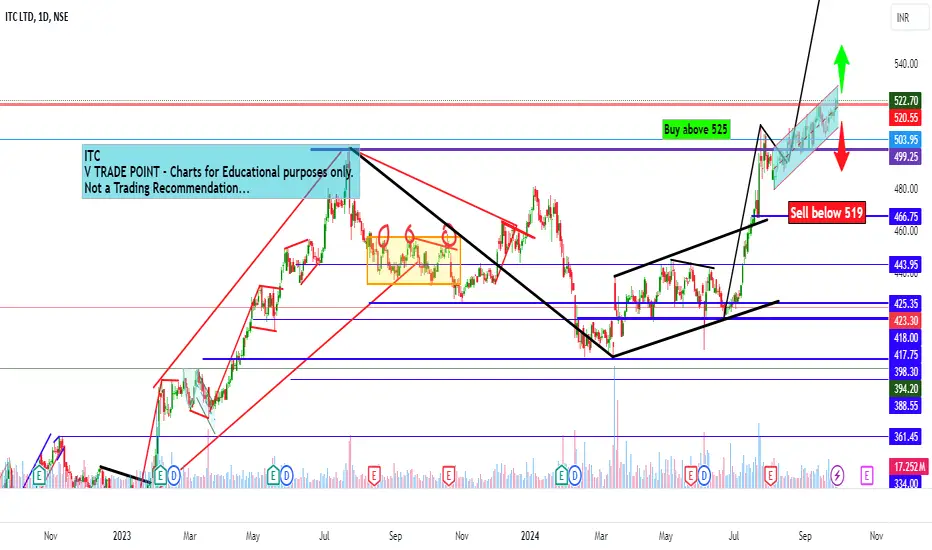
Charts for Educational purposes only.
Please follow strict stop loss and risk reward if you follow the level.
Thanks,
V Trade Point

ITC: Bearish Momentum UnfoldsITC: Bearish Momentum - Short Trade Setup
ITC Key Points
The 4-hour chart of ITC confirms a sustained downtrend, with TP1 and TP2 targets successfully achieved.
The price action suggests the continuation of this bearish momentum, keeping TP3 and TP4 firmly in sight.
Trade Details:
Entry Price: ₹508.85
Stop Loss: ₹518.65 (strategically placed above resistance)
Targets:
TP1: ₹496.70 ✅
TP2: ₹477.05 ✅
TP3: ₹457.40 (potential) 🔄
TP4: ₹445.25 (final target) 🔄
ITC Share Analysis:
Risological Alignment: The Risological trend line slopes downward, confirming the prevailing bearish trend.
Price Structure: Lower highs and lower lows indicate a clear seller-dominant market environment.
Momentum Strength: Strong red candles suggest heightened bearish activity, increasing the likelihood of hitting the remaining targets.
Action Plan:
Existing Traders: Secure partial profits and trail stops to lock in gains.
New Entrants: Wait for minor retracements toward the entry level for an optimal risk-to-reward ratio.
ITC's bearish journey continues—watch for TP3 and TP4! 🛑📉


ITC Ltd for Intraday 25th October #ITC ITC Ltd for Intraday 25th October #ITC
Resistance 476. Watching above 476 for upside movement...
Support area 470. Below 470 ignoring upside momentum for intraday
Support 470.Watching below 468 for downside movement...
Resistance area 475-476
Above 475 ignoring downside move for intraday
Charts for Educational purposes only.
Please follow strict stop loss and risk reward if you follow the level.
Thanks,
V Trade Point

ITC | Intraday | NSE15m Time Frame : Price reached to strong resistance zone
failed multiple attempted to break the resistance zone
Today(16th Oct) likely to move bearish trend
take short position followed by buy-side LQ sweep and bearish candle confirmation

ITC ltd view for Intraday 14th October #ITC ITC ltd view for Intraday 14th October #ITC
Buying may witness above 493
Support area 484-488. Below ignoring buying momentum for intraday
Selling may witness below 484
Resistance area 490
Above ignoring selling momentum for intraday
Charts for Educational purposes only.
Please follow strict stop loss and risk reward if you follow the level.
Thanks,
V Trade Point

look Out, ITC exhausting!ITC appears to be exhausting its upmove, signaling a potential downmove. After a strong rally, the stock is showing signs of overbought conditions, with technical indicators like the Relative Strength Index (RSI) suggesting a reversal. Additionally, profit-taking by investors and a lack of fresh buying interest could contribute to a downward trend. Market sentiment and external factors, such as economic data or sector performance, may further influence ITC’s price movement in the near term. View becomes invalid if daily close is above 515.
Disclaimer: All ideas are my personal views and not financial advise. I do not have any Telegram channel nor do I sell any courses.

ITC S/RSupport and Resistance Levels:
Support Levels: These are price points (green line/shade) where a downward trend may be halted due to a concentration of buying interest. Imagine them as a safety net where buyers step in, preventing further decline.
Resistance Levels: Conversely, resistance levels (red line/shade) are where upward trends might stall due to increased selling interest. They act like a ceiling where sellers come in to push prices down.
Breakouts:
Bullish Breakout: When the price moves above resistance, it often indicates strong buying interest and the potential for a continued uptrend. Traders may view this as a signal to buy or hold.
Bearish Breakout: When the price falls below support, it can signal strong selling interest and the potential for a continued downtrend. Traders might see this as a cue to sell or avoid buying.
20 EMA (Exponential Moving Average):
Above 20 EMA(50 EMA): If the stock price is above the 20 EMA, it suggests a potential uptrend or bullish momentum.
Below 20 EMA: If the stock price is below the 20 EMA, it indicates a potential downtrend or bearish momentum.
Trendline: A trendline is a straight line drawn on a chart to represent the general direction of a data point set.
Uptrend Line: Drawn by connecting the lows in an upward trend. Indicates that the price is moving higher over time. Acts as a support level, where prices tend to bounce upward.
Downtrend Line: Drawn by connecting the highs in a downward trend. Indicates that the price is moving lower over time. It acts as a resistance level, where prices tend to drop.
RSI: RSI readings greater than the 70 level are overbought territory, and RSI readings lower than the 30 level are considered oversold territory.
Combining RSI with Support and Resistance:
Support Level: This is a price level where a stock tends to find buying interest, preventing it from falling further. If RSI is showing an oversold condition (below 30) and the price is near or at a strong support level, it could be a good buy signal.
Resistance Level: This is a price level where a stock tends to find selling interest, preventing it from rising further. If RSI is showing an overbought condition (above 70) and the price is near or at a strong resistance level, it could be a signal to sell or short the asset.
Disclaimer:
I am not a SEBI registered. The information provided here is for learning purposes only and should not be interpreted as financial advice. Consider the broader market context and consult with a qualified financial advisor before making investment decisions.
Will ITC Break the support and decline?It looks like ITC has made a sharp rise and now the time to redecide the next trend

ITC--longis accumulating and we have a 5th wave target of 440-450 every dip is a buy .MACD is yet to show a sell and as negative divergence looks that it would be ripe to sell near to 440-50 range our 5th wave target

ITC Ltd view for Intraday 30th September #ITC ITC Ltd view for Intraday 30th September #ITC
Buying may witness above 525
Support area 519-520. Below ignoring buying momentum for intraday
Selling may witness below 519
Resistance area 525
Above ignoring selling momentum for intraday
Charts for Educational purposes only.
Please follow strict stop loss and risk reward if you follow the level.
Thanks,
V Trade Point
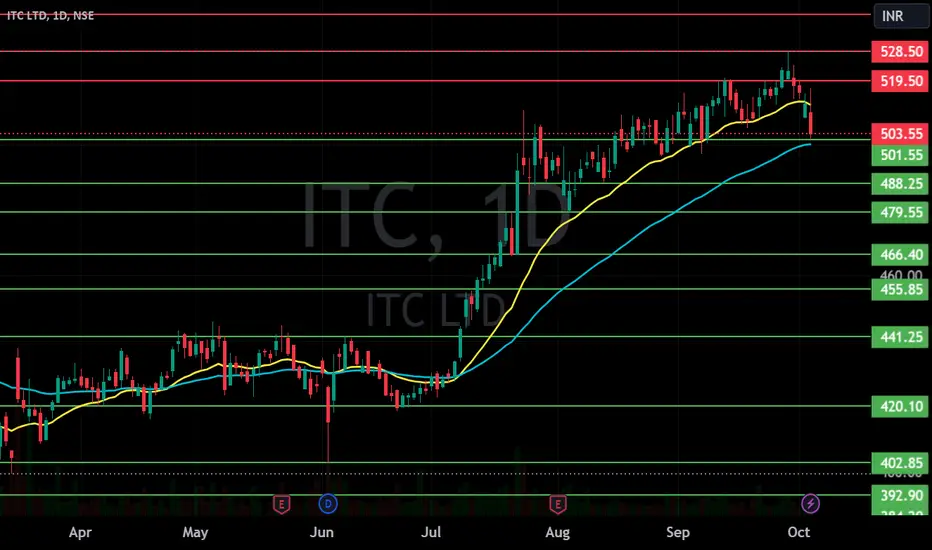
ITC all time high breakoutDisclaimer: I am Not SEBI Registered adviser, please take advise from your financial adviser before investing in any stocks. Idea here shared is for education purpose only.
26.09.2024 Swing paper trade
Buy- CPM
Target- 538,556,574,+++
Stop Loss-478
#papertrade #learningonly #Swing trade
1.Breakout- all time high break out
2.Volume- Rise in average volume
3. RSI-Bullish
4. Chart Pattern- moving forword with trend line.
News:- ITC shares hit record high, market-cap moves past Rs 6.5 lakh crore for the first time
Maker of instant noodle brand Wai Wai plans pre-IPO funding for Indian unit in 2025


ITC--BUY ON DIPCONTINUESin 5th wave target of 540 min as per fibo ext . Inverse head and shoulder gives us a target of 530 trendline resistance also marked.

ITC good trade tow trade short term & long term Itc is flag pattern is continue running & short trade is raising wedge pattern break out its large cap company have more safety if something going wrong
Short trade target as chart pattern - 556rs
Long term target as per char NSE:ITC t - 600

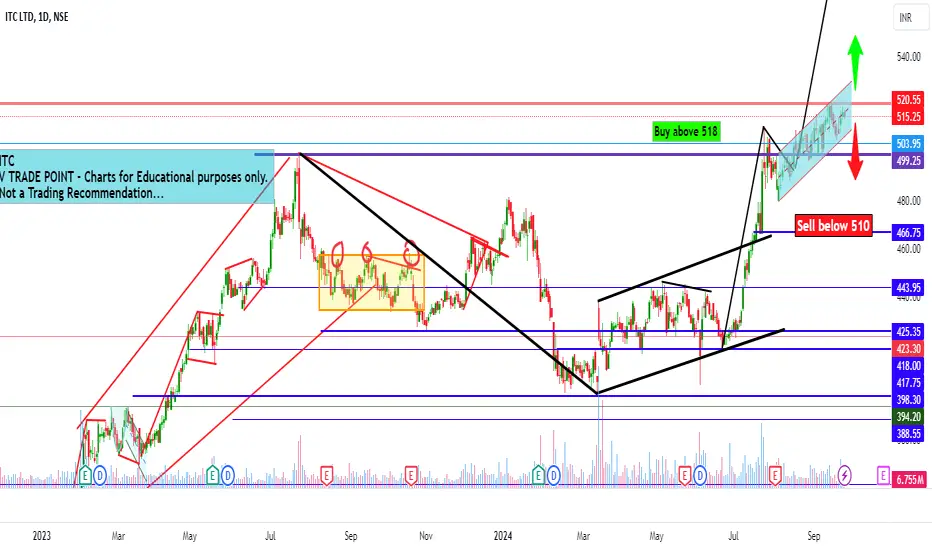
ITC Ltd view for Intraday 25th September #ITC ITC Ltd view for Intraday 25th September #ITC
Buying may witness above 518
Support area 510. Below ignoring buying momentum for intraday
Selling may witness below 510
Resistance area 516-518
Above ignoring selling momentum for intraday
Charts for Educational purposes only.
Please follow strict stop loss and risk reward if you follow the level.
Thanks,
V Trade Point
ITC Ltd view for Intraday 24th September #ITC ITC Ltd view for Intraday 24th September #ITC
Buying may witness above 518
Support area 512. Below ignoring buying momentum for intraday
Selling may witness below 512
Resistance area 518
Above ignoring selling momentum for intraday
Charts for Educational purposes only.
Please follow strict stop loss and risk reward if you follow the level.
Thanks,
V Trade Point
