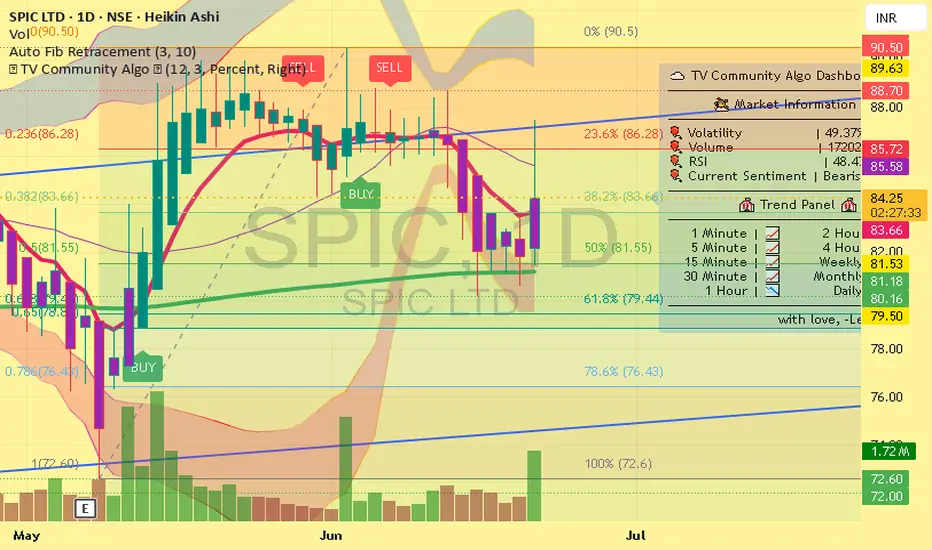
buy SPIC for target 170buy SPIC with SL 79 for the target of 170 time horizon next 2 qtr , position built with strict sl , above 90 monthly closing may add fire in it, 3 yrs symtirical triangle breakout expected. early monsoon, israel iran clash, demand supply, gap can reason for it, and chart support it.
0.46 USD
18.41 M USD
365.04 M USD
About SPIC LTD
Sector
Industry
Website
Headquarters
Chennai
Founded
1969
FIGI
BBG000MKLH27
Southern Petrochemical Industries Corp. Ltd. engages in the manufacture and sale of fertilizers. It operates through Agro Inputs and Others segments. The Agro Inputs segment includes operations in Urea. The Others segment focuses on agri business. The company was founded on December 18, 1969 and is headquartered in Chennai, India.
Related stocks
SPIC--compulsive buyA good fertilizer stock trading near to 200 days EMA . Low PE of 11.2 intrinsic value of 196 making rounded bottom with higher low and higher high with second inverse head and shoulder in making . we have a minimum target of 115-120 resistance on weekly chart if breaks out then higher target of

SPIC--BULLISH SET UPSPIC--DAY ABOVE 9,21,50 and 200 EMA bullish stock--inverse head and shoulder formation at breakout---level---trading on upper boundary of BB. book value 56 and EPS of 5.5

Key Support / Resistance Breakout - Swing TradeDisclaimer: I am not a Sebi registered adviser.
This Idea is publish purely for educational purpose only before investing in any stocks please take advise from your financial adviser.
Key Support & Resistance Breakout. Stock has give Breakout of Resistance level. Keep in watch list. Buy above the h

SPIC--ACCUMULATEparticular stock is making higher low continuously and might be in multi year bull run once breakouts of trendline you will see vertical rise .

"SPIC Ltd Ready for a Major Bullish Breakout – High Growth PotenSPIC Ltd is flashing strong bullish signals on the 1D timeframe, hinting at an upcoming breakout. This stock is primed for a significant uptrend, making it a top candidate for traders seeking substantial gains in the coming weeks. Don’t miss out on this high-potential opportunity—SPIC Ltd could be y

SPIC-BUYSPIC--heading toward 113-14 range once crosses 114 likely to make multi month high MARCH qtr was bad due to floods and renovation of plant inspite of it company declared a dividend .likely to make multi month highs in times to come.

SPIC LOOKING GOOD IN MONSOON Entry at 64to 66
Target 90Rs
This counter can easily reach at 90 Rs within 6 months.
Good level to invest

SPIC BREAKOUTAll time high Breakout.
Good Volume seen in Weekly chart.
Target 123 ,175 .
Disclaimer : This is not a Buy or Sell recommendation. Please consult your financial advisor before making any investments . This is for Educational purpose only.

Bullish on SPIC Bullish view on SPIC
Buy above 94
SL 85
Target 130+
Disclaimer -Do your analysis before invest.we are not responsible for your profit and loss, it's only for education purpose analysis.

See all ideas
Summarizing what the indicators are suggesting.
Oscillators
Neutral
SellBuy
Strong sellStrong buy
Strong sellSellNeutralBuyStrong buy
Oscillators
Neutral
SellBuy
Strong sellStrong buy
Strong sellSellNeutralBuyStrong buy
Summary
Neutral
SellBuy
Strong sellStrong buy
Strong sellSellNeutralBuyStrong buy
Summary
Neutral
SellBuy
Strong sellStrong buy
Strong sellSellNeutralBuyStrong buy
Summary
Neutral
SellBuy
Strong sellStrong buy
Strong sellSellNeutralBuyStrong buy
Moving Averages
Neutral
SellBuy
Strong sellStrong buy
Strong sellSellNeutralBuyStrong buy
Moving Averages
Neutral
SellBuy
Strong sellStrong buy
Strong sellSellNeutralBuyStrong buy
Displays a symbol's price movements over previous years to identify recurring trends.