ULC14 trade ideas

Ultracemco - Pennant - Triangle BreakoutUltracemco gave pennant breakout on 4hr TF with considerable volume. Its on all time high so supply can be seen at top. Lets see how it react on top, Targets on chart...


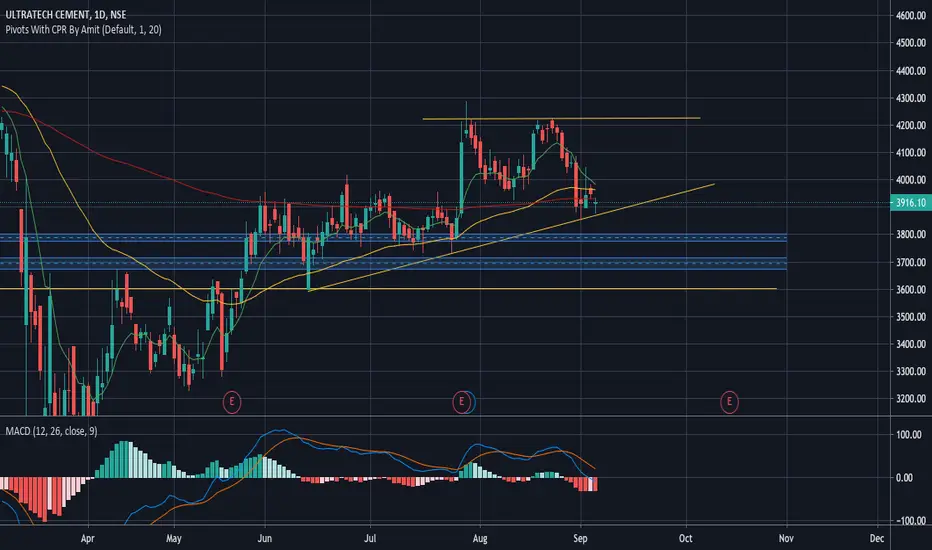
ULTRATECH CEMENT WEEKLY BEARISH GARTLEY
Earlier this same Pattern given good reaction on Type1 entry & Hit TARGETS
now price again came into PRZ Zone of Pattern it becomes a TYPE2 Entry which is REVERSAL
price need to follow Green Trend line & hit target
If price Breaks Red Trend line is where EXIT before SL hits
POTENTIAL SELL

ULTRATECH CEM LOOK OUT FOR THESE LEVELS!!! ALL THE LEVELS AND PATTERNS ARE MARKED ON CHART, RED ZONES DENOTES SUPPLY ZONES AND GREEN IS FOR DEMAND ZONE.
4855-4870 CAN ACT AS GOOD RESISTANCE
BUY ABOVE 4855-4870 IF THE LEVEL IS BROKEN WITH VOLUME AND CONVICTION.
The indicator used:
1) Daily Lines plots Daily 20 (BLACK) & 50 EMA (GREY) on lower time frame charts
2) TE-REKAB
- PB : PULLBACK
If you like the analysis, do leave a like and follow for more such content coming up.
The analysis is my POV, hope you got bucks in your pocket to consult a financial advisor before investing :P :)
HAPPY TRADING!


Live Intraday Trading - Jumping from the peak of a mountain !!If you see the daily chart of ULTRATECH CEMENT , then it looks exactly similar to a mountain .
It was just a scenario where you are on the top of the mountain and heavy rain starts flowing down .
What will happen in that condition , you are surely going to come down along with the pressure of the water.


Ultratech: Classical Example of a Complete Wave CycleIt seems one cycle is complete and we are now in Second bull cycle. Alternatively we may be in Wave 5 and now we are entering into sub-wave 3 of Wave 5


R-0220 Sell ULTRACEMCO @3783.3-3789.30 SL 3854 TGT 3672Intraday Cash Sell ULTRACEMCO @3783.3-3789.30 SL 3854 TGT 3672
MACD cross over + cloud break down + break crucial support 3783 next support 3660 GO SHORT


UltratechPoints to consider :
Held on previous (recent) support.
Need to break out of trend line with volume
Stochastic needs to cross 25
RSI needs to be above 55 - 60 levels
Again 9 EMA to cross 21EMA and need a good candle.
If above all is satisfies 4200 - 4250 possible.

Buy till deep SL 3830 / Rest levels on plotted on chartNSE:ULTRACEMCO
Disclaimer: I am not a SEBI register person please contact your financial advisor for advice.


Ultratech (Will it continue towards the downside ?)Ultratech has formed a beautiful trend line and has tested it twice in the last few days with any upward movement being strongly rejected. A breach of the trend line is looking like a possibility now. Any breach should give us a good momentum but since the stock will be entering any area of multiple support zones one should be cautious while setting up targets. Even though i believe the move should ideally be a strong one there is very little room for certainty in this volatile market.
The moving averages might form a death cross (Lower TF moving average breaching the higher TF moving average from the upside, in this case 9EMA (Green Line) breaching the 50 and 200EMA (Yellow and Red Line) from the upside) in case the price moves further down which might further fuel the downward movement. The MACD indicator has gone into negative territory after long indicating move downside pressure. All these things might add up in case the price moves downwards. Any reversal from herein should be followed by good volumes and the price sustaining above 4000 levels.
It will be interesting to see what the chart holds for us.
Which side will you be betting on ?
Ultratech good long candidate in prz zoneultratech cement have formed bullish gartley pattern fomation on hourly time frame,, perfect fibonacci retracement levels as per harmonic study,, counter can give strong reversal from this levels ,, view gets negated below 3820.....
