MAGICUSDT trade ideas

MAGIC : Magic is neededHello friends🙌
📈Given the good rise we had, the price is now in the ascending channel, now in the specified support areas, you can buy in steps with risk and capital management and move to the specified targets.
🔥Follow us for more signals🔥
*Trade safely with us*

MAGIC (SPOT)BINANCE:MAGICUSDT
#MAGIC / USDT
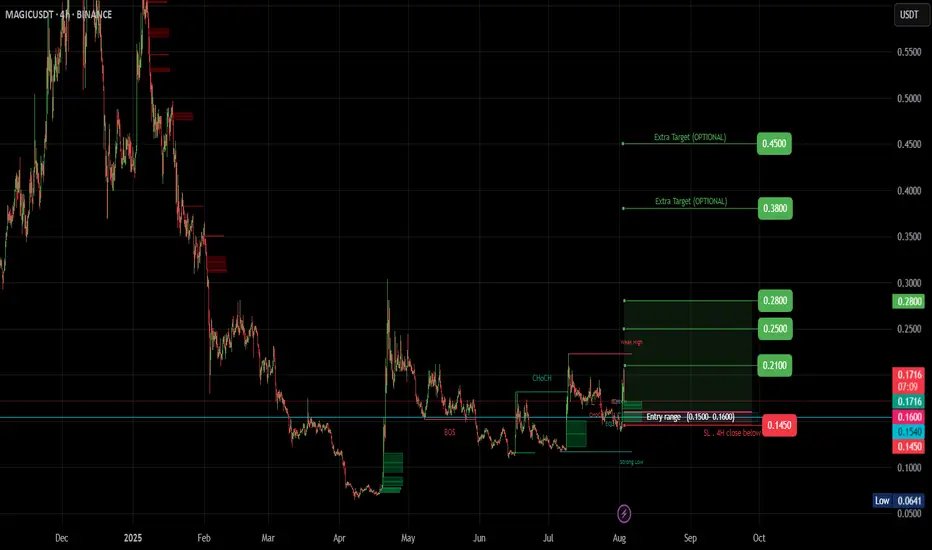
Entry range (0.150- 0.160) **** Wait for the price to come to the entry range ****
SL 4H close below 0.145
T1 0.210
T2 0.250
T3 0.280
Extra Targets
T1 0.380
T2 0.450
_______________________________________________________
Golden Advices.
********************
* collect the coin slowly in the entry range.
* Please calculate your losses before the entry.
* Do not enter any trade you find it not suitable for you.
* No FOMO - No Rush , it is a long journey.
MAGIC (SPOT)BINANCE:MAGICUSDT
#MAGIC / USDT
Entry range (0.240- 0.260)
SL 4H close below 0.230
T1 0.33
T2 0.39
T3 0.42
Extra Targets
T1 0.48
_______________________________________________________
Golden Advices.
********************
* collect the coin slowly in the entry range.
* Please calculate your losses before the entry.
* Do not enter any trade you find it not suitable for you.
* No FOMO - No Rush , it is a long journey.

MAGIC Buy/Long Setup (1D)On the chart, an important trigger line has been broken. A strong bullish CH (Change of Character) is also visible on the chart.
The green zone is a low-risk area for a rebuy.
Targets are marked on the chart.
A daily candle close below the invalidation level will invalidate this analysis.
For risk management, please don't forget stop loss and capital management
Comment if you have any questions
Thank You

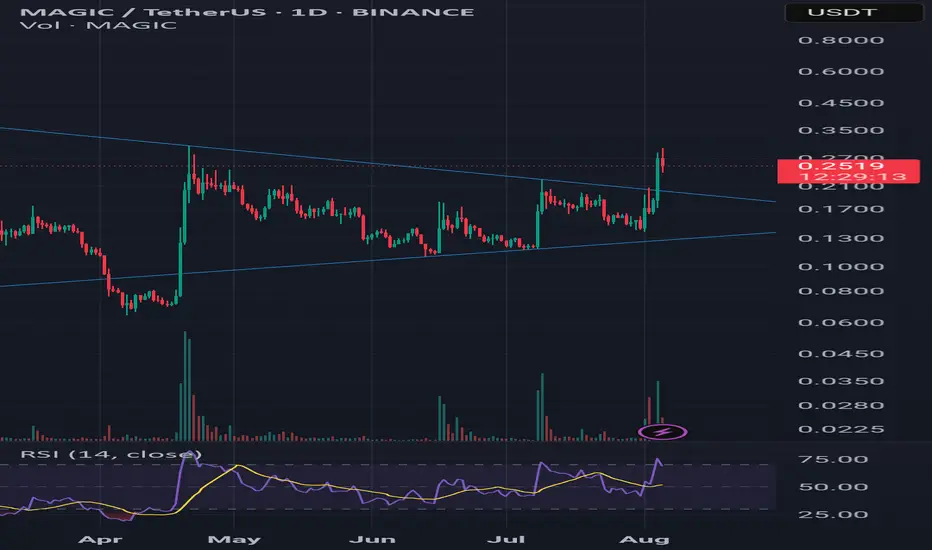
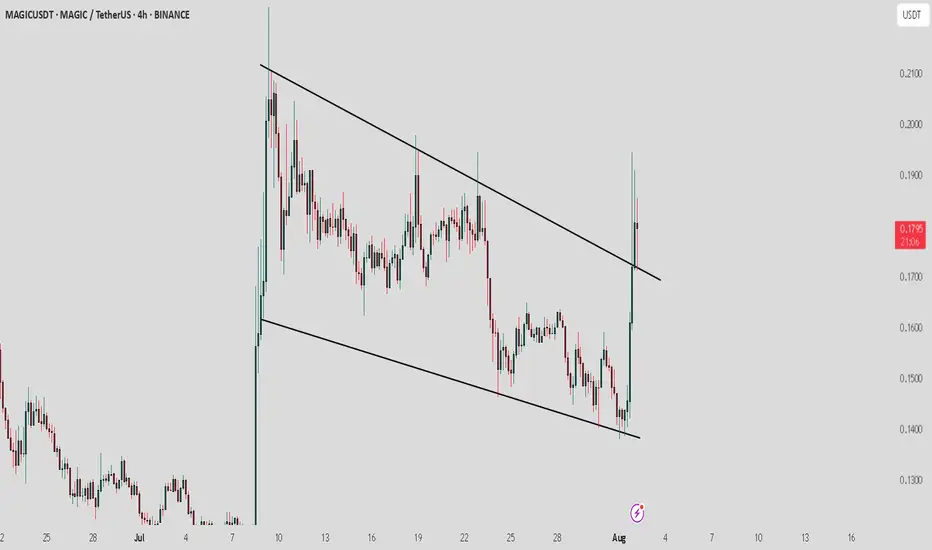
MAGICUSDT 1D#MAGIC is moving inside a symmetrical triangle — it's decision time: breakout or breakdown?
If it manages to break above the triangle resistance and the daily SMA200, the potential upside targets are:
🎯 $0.2214
🎯 $0.3187
🎯 $0.3973
🎯 $0.4759
However, in case of a breakdown and a daily candle close below the triangle, it may retest the support level at $0.1149.
⚠️ As always, use a tight stop-loss and apply proper risk management.

MAGICUSDT.P 15m – Short Setup at Key Fib ResistancePrice sharply rejected from the 0.2042 high and is now breaking below the 50%–61.8% Fibonacci retracement zone after a lower high. The move shows strong selling interest, aligning with MACD histogram momentum shift into the negative.

#MAGIC/USDT Falling Wedge + Fib Confluence #MAGIC
The price is moving within a descending channel on the 1-hour frame, adhering well to it, and is on its way to breaking strongly upwards and retesting it.
We have support from the lower boundary of the descending channel at 0.1620.
We have a downtrend on the RSI indicator that is about to be broken and retested, supporting the upside.
There is a major support area in green at 0.1662, which represents a strong basis for the upside.
Don't forget a simple thing: ease and capital.
When you reach the first target, save some money and then change your stop-loss order to an entry order.
For inquiries, please leave a comment.
We have a trend to hold above the 100 Moving Average.
Entry price: 0.1780.
First target: 0.1827.
Second target: 0.1905.
Third target: 0.1962.
Don't forget a simple thing: ease and capital.
When you reach your first target, save some money and then change your stop-loss order to an entry order.
For inquiries, please leave a comment.
Thank you.

#MAGIC/USDT#MAGIC
The price is moving within a descending channel on the 1-hour frame, adhering well to it, and is on its way to breaking strongly upwards and retesting it.
We have support from the lower boundary of the descending channel, at 0.1560.
We have a downtrend on the RSI indicator that is about to break and retest, supporting the upside.
There is a major support area in green at 0.1555, which represents a strong basis for the upside.
Don't forget a simple thing: ease and capital.
When you reach the first target, save some money and then change your stop-loss order to an entry order.
For inquiries, please leave a comment.
We have a trend to hold above the 100 Moving Average.
Entry price: 0.1600.
First target: 0.1640.
Second target: 0.1677.
Third target: 0.1719.
Don't forget a simple thing: ease and capital.
When you reach your first target, save some money and then change your stop-loss order to an entry order.
For inquiries, please leave a comment.
Thank you.

#MAGIC/USDT#MAGIC
The price is moving within a descending channel on the 1-hour frame, adhering well to it, and is on its way to breaking strongly upwards and retesting it.
We have support from the lower boundary of the descending channel, at 0.1474.
We have a downtrend on the RSI indicator that is about to break and retest, supporting the upside.
There is a major support area in green at 0.1700, which represents a strong basis for the upside.
Don't forget a simple thing: ease and capital.
When you reach the first target, save some money and then change your stop-loss order to an entry order.
For inquiries, please leave a comment.
We have a trend to hold above the 100 Moving Average.
Entry price: 0.1800.
First target: 0.1837.
Second target: 0.1900.
Third target: 0.1958.
Don't forget a simple thing: ease and capital.
When you reach your first target, save some money and then change your stop-loss order to an entry order.
For inquiries, please leave a comment.
Thank you.

MAGIC / USDT : Bullish breakout alert
MAGIC/USDT has recently broken its descending trendline, signaling potential for a 35 - 50% upside move in the coming weeks. This breakout could lead to significant growth if the bullish momentum continues!
Key Point: A solid retest above the breakout zone will confirm the uptrend, targeting a potential rise of up to 0.25. Stay alert!

MAGIC / USDT – Symmetrical Triangle Breakout | Pullback OpportunMAGIC has recently broken out of a symmetrical triangle pattern that had been forming for several months. The breakout occurred with strong bullish volume and was accompanied by an RSI breakout above its MA, suggesting solid momentum behind the move.
📏 Technical Notes:
A descending dynamic resistance has been finally broken.
The price has clearly exited the symmetrical triangle, which often leads to explosive moves.
According to the height of the triangle’s base (~0.22), a technical target of around 0.45–0.47 can be projected.
📉 Possible Pullback:
A retest of the breakout zone around 0.20–0.21 is likely before continuation. This area also aligns with the upper triangle boundary, now turned into support.
---
🎯 Bullish Targets (Based on Triangle Breakout):
TP1: 0.30
TP2: 0.42
TP3: 0.47 (Full triangle target)
---
🛑 Stop Loss Suggestion:
Below 0.19, if the breakout fails and the price falls back into the triangle.
---
📊 Indicators:
RSI above 70 with bullish crossover.
Volume spike during breakout confirms institutional or whale interest.
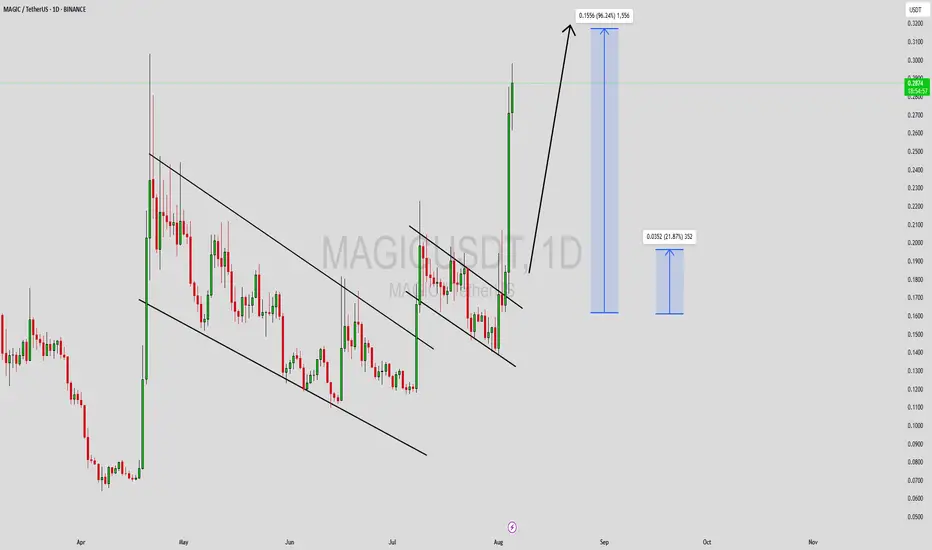
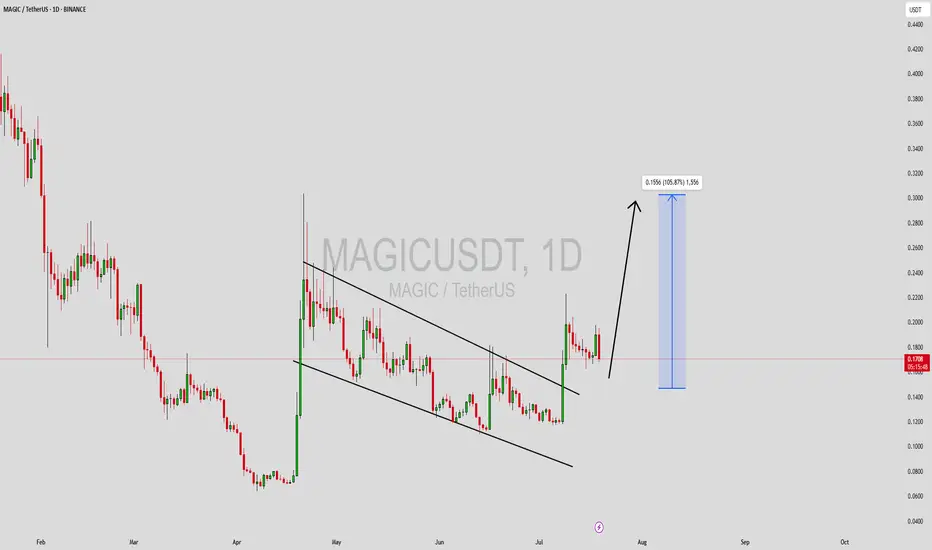
MAGICUSDT Forming Falling WedgeMAGICUSDT is currently forming a classic Falling Wedge Pattern, a bullish reversal setup that often indicates a trend shift from bearish to bullish. This pattern is characterized by converging trendlines that slope downward, with declining volume throughout its formation—a sign that selling pressure is gradually decreasing. The breakout from this structure is typically explosive, making this setup highly attractive to traders looking for high-reward opportunities.
Volume on MAGICUSDT remains strong, a vital confirmation for the validity of the wedge pattern. Sustained buying volume after a breakout often signals the beginning of a substantial rally. As of now, MAGIC appears poised to challenge resistance levels, and if the breakout occurs, we could see a price surge of 90% to 100% or more, aligning with historical wedge breakouts in crypto markets.
The broader sentiment around the MAGIC ecosystem is also showing positive momentum. As a key player in the decentralized gaming and NFT infrastructure space, MAGIC has consistently drawn attention from investors who believe in the long-term potential of Web3 gaming. Its integration with various metaverse projects and innovative use cases continues to attract both developers and traders.
This combination of bullish technical structure, growing trading interest, and strong fundamentals makes MAGICUSDT one of the more promising setups in the current market cycle. Keep an eye on key breakout levels, as the next leg up could come with swift and significant price movement.
✅ Show your support by hitting the like button and
✅ Leaving a comment below! (What is You opinion about this Coin)
Your feedback and engagement keep me inspired to share more insightful market analysis with you!
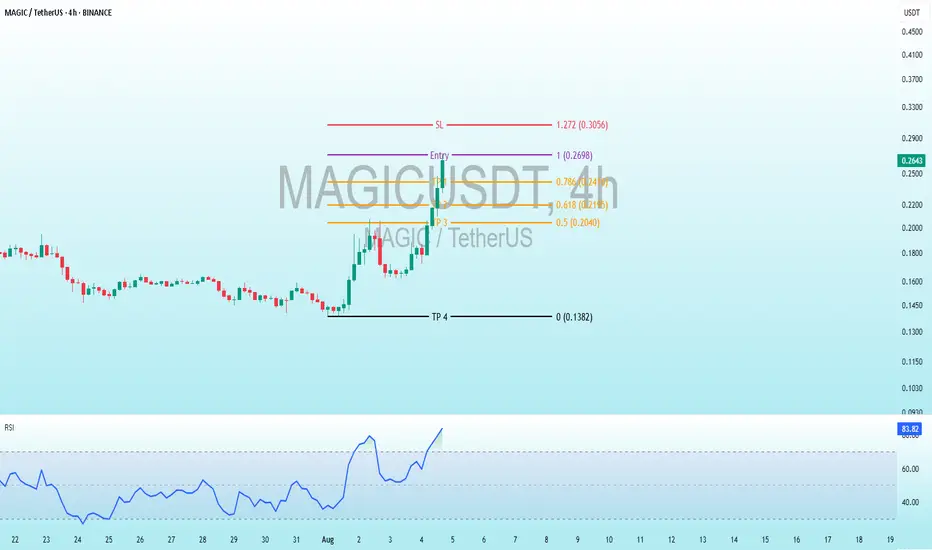
MAGIC Bearish DivergenceBINANCE:MAGICUSDT
Trade Setup:
Target 1: 0.2416(0.786 Fibonnaci Golden Zone).
Target 2: 0.2195 (0.618 Fibonnaci Golden Zone).
Target 3: 0.2040 (0.5 Fibonnaci Golden Zone).
Target 4: 0.1382 (0 Fibonnaci).
Stop Loss: 0.2979 (1.272 Fibonacci).
The RSI is at 84.33, indicating overbought conditions (above 70), which suggests a potential reversal or consolidation may be near unless the trend strengthens further.
magic short Long upper wicks (like inverted hammers or shooting stars)
Multiple candles failing to close above $0.21–0.215
Bearish volume spike with price stalling = aggressive sellers
Low volume stall = buyers exhausted
Dropping from above 70
Bearish divergence vs price
You can consider a short with a tight stop just above $0.215–0.22
Targets: $0.1980 → $0.1880 → $0.1780
MAGIC/ USDT: Retest is in progress, keep a watch on confirmationMAGIC / USDT has broken out from the Trendline resistance and retest is still in progress . However, the market conditions are not ideal right now.
Bullish scenario : If the price holds above the breakout level and the retest is confirmed, the next target could be 0.19–0.21.
Bearish scenario : A failure to maintain above the breakout level may lead to a drop back to 0.15 or 0.13.
Pro Tip: Use tight stop-losses below the breakout point. Wait for confirmation before committing larger positions. Keep an eye on BTC dominance
#MAGIC/USDT#MAGIC
The price is moving within a descending channel on the 1-hour frame, adhering well to it, and is on its way to breaking it strongly upwards and retesting it.
We have a bounce from the lower boundary of the descending channel, this support at 0.
We have a downtrend on the RSI indicator that is about to break and retest, supporting the upside.
There is a major support area in green at 0.1670, which represents a strong basis for the upside.
Don't forget a simple thing: ease and capital.
When you reach the first target, save some money and then change your stop-loss order to an entry order.
For inquiries, please leave a comment.
We have a trend to hold above the 100 Moving Average.
Entry price: 0.1700
First target: 0.1780
Second target: 0.1872
Third target: 0.1980
Don't forget a simple thing: ease and capital.
When you reach the first target, save some money and then change your stop-loss order to an entry order.
For inquiries, please leave a comment.
Thank you.

MAGICUSDT Forming Falling WedgeMAGICUSDT is currently showing a promising technical structure as it breaks out of a classic falling wedge pattern on the daily chart. This pattern is widely recognized for its bullish implications, especially when accompanied by increased volume, as seen in recent trading sessions. The falling wedge breakout suggests a potential reversal from the previous downtrend, with a projected gain of 90% to 100%+ in the coming weeks if momentum continues to build.
The Magic ecosystem, built around gaming and decentralized metaverse infrastructure, continues to attract investor interest due to its unique positioning in the Web3 and NFT sectors. With new partnerships and platform developments emerging, the fundamentals are aligning with the technicals for a potential significant rally. The current price action reflects a growing accumulation phase, indicating strong hands entering at lower levels.
As altcoin recovery gains traction across the broader market, MAGIC is positioned to benefit from both renewed retail attention and institutional curiosity. A breakout above the wedge resistance line can serve as a confirmation trigger for long entries, with a clear risk-to-reward setup. Traders should keep an eye on volume confirmation and short-term resistance levels for scaling out opportunities as the price climbs.
✅ Show your support by hitting the like button and
✅ Leaving a comment below! (What is You opinion about this Coin)
Your feedback and engagement keep me inspired to share more insightful market analysis with you!
$MAGIC breaking out! OMXTSE:MAGIC breaking out! 🚀
Price just moved out of the falling wedge.
If it comes back down, that could be a good buy zone.
Looks ready for a strong move up!
DYOR, NFA

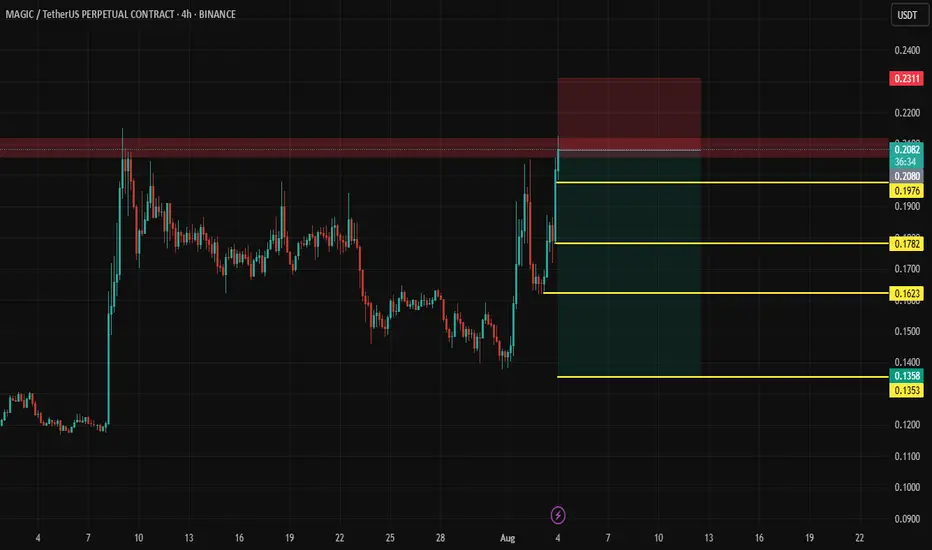
Limit Long on MAGICLimit long placed on MAGIC after strong impulsive breakout and retrace into structural support, overlapping the golden pocket zone and anchored volume clusters. Price is compressing just below a minor supply shelf, and the setup targets a continuation move into recent highs. Risk is tightly defined with favorable reward-to-risk, and capital protection is structured early.
I'm entering before full confirmation to gain better RR. The trade accepts possible deeper pullback or invalidation in exchange for prime fill location and front-running potential continuation.
The setup blends 4H and 15M structure. On the 4H, price retraced into the 0.382–0.5 fib levels from the July breakout and is holding above EMA confluence and mid-channel demand. The 15M shows fair value gaps, order blocks, and volume shelf demand near 0.1855, with recent wicks rejecting lower prices. A higher low may be forming.
Limit Long MAGICUSDT.P
Entry: $0.1855
Stop-Loss: $0.1823
Total Risk: 1% of account capital
TP1: $0.1975 (40% – cover exposure + reduce risk). Move SL to BE
TP2: $0.2043 (40% – primary exit near local supply)
TP3: $0.2150 (20% – continuation target)
Take profit one locks in early gains and removes risk. TP2 aims for full move toward prior swing highs. TP3 leaves a runner in case continuation develops. SL is tucked just under the 15M structure and key volume support, outside minor wick zones but tight enough for good RR.
✅ Weekly bullish structure
✅ 4H demand + fib retrace
✅ 1H volume support + BOS
✅ 15M OB + FVG rejection
DISCLAIMER: I am not providing trading signals or financial advice. The information shared here is solely for my own documentation and to demonstrate my trading journey. By openly sharing my process, I aim to put pressure on myself to stay focused and continually improve as a trader. If you choose to act on any of this information, you do so at your own risk, and I will not be held responsible for any outcomes. Please conduct your own research and make informed decisions.

Scalp long MagicJust wanna scalp long here for w5 formation. taarget recent high or a conservative of 0.2117

MAGIC | Breakout AttemptMAGIC is attempting a breakout from its long-term descending channel pattern.
Analysis:
RSI shows momentum building from oversold levels
Multiple VWAP indicators suggest institutional accumulation
Risk Factors:
Breakout needs volume confirmation
Failure at resistance could lead to retest of $0.20 support
Overall crypto market conditions remain influential
This setup offers attractive risk-to-reward if the breakout is confirmed by volume.

#MAGIC broke above the resistance!#MAGIC
The price is moving within a descending channel on the 1-hour frame, adhering well to it, and is heading for a strong breakout and retest.
We have a bounce from the lower boundary of the descending channel. This support is at 0.1160.
We have a downtrend on the RSI indicator that is about to be broken and retested, supporting the upside.
There is a major support area in green at 0.1143, which represents a strong basis for the upside.
Don't forget a simple thing: ease and capital.
When you reach the first target, save some money and then change your stop-loss order to an entry order.
For inquiries, please leave a comment.
We have a trend to hold above the 100 Moving Average.
Entry price: 0.1181
First target: 0.1210
Second target: 0.1239
Third target: 0.1293
Don't forget a simple thing: ease and capital.
When you reach the first target, save some money and then change your stop-loss order to an entry order.
For inquiries, please leave a comment.
Thank you.
