$MAGIC is breaking out after 30+ days of consolidation!Now testing the trendline with strong support at $0.16–$0.17 and holding above the 100 EMA.
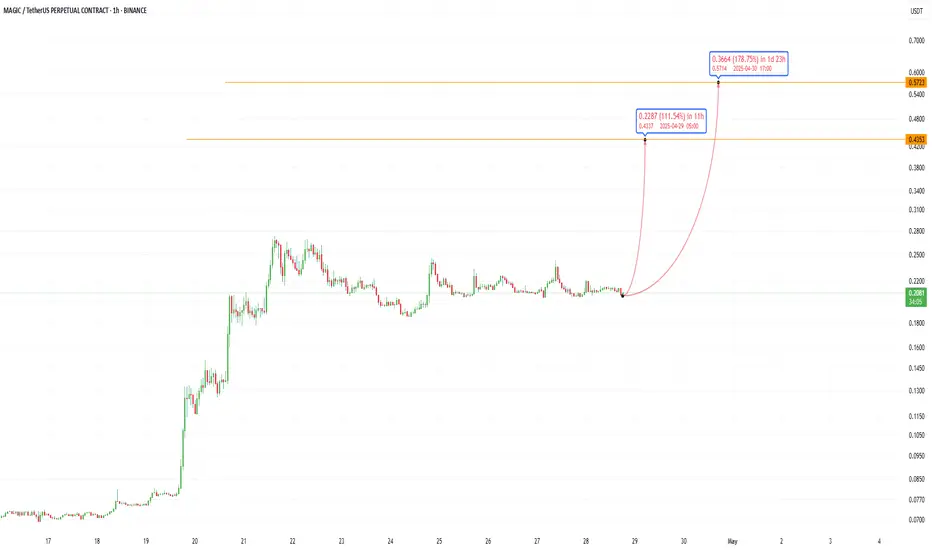
If confirmed, we could see a move toward $0.36+ 🚀
Entry: CMP $0.1811
SL: $0.1631
Target: $0.3623
DYRO, NFA
MAGICUSDT trade ideas

$MAGIC Trade Setup Alert!Bull flag breakout on OMXTSE:MAGIC — and we’re eyeing a beautiful move next! 👀📈
Price is testing breakout levels right now with solid bullish momentum.
🎯 Targets:
• TP1: $0.2037
• TP2: $0.2731
• TP3: $0.3996+
🛑 SL: $0.1547
📌 Entry Zone: Around $0.1710
Breakout traders, this is your cue!

$MAGIC Loading Up for a Breakout After 32 Days of Silence!OMXTSE:MAGIC has been forming this symmetrical triangle pattern for over 32 days, that's more than a month of consolidation!
Price is squeezing tighter inside the range, and a breakout is getting closer.
If it breaks above the upper trendline with volume, we could see a move toward $0.22–$0.28 🚀
This setup is worth watching closely, long consolidation often leads to strong moves.
Retweet if you're bullish !!
#MAGIC #Alts

MAGIC/USDT – From Consolidation to Explosion?🚀 MAGIC Bull Flag Formation – 200% Potential Incoming?! 👀🔥
Hey Traders! If you're all about high-conviction plays and real alpha, smash that 👍 and tap Follow for more setups that actually deliver! 💹💯
MAGIC is showing strong signs of a breakout from the descending channel on the 4H timeframe. After consolidating inside the channel for weeks, it has now approached the upper boundary and is testing it with bullish momentum supported by the EMA.
🟢 Long Position Activated
🔹 Breakout Confirmation waaiting
🔹 Volume Picking Up 📊
🔹 EMA Flip Incoming 🔄
🎯 Targets:
TP1: $0.25
TP2: $0.31
TP3: $0.39
TP4: $0.46+
🛑 Stop-loss: $0.151
📌 Leverage: 5x max
💡 A clean breakout from here can lead to a massive move—just like last time with a 273% pump! Don’t sleep on this one.


MAGICUSDT 1D AnalysisMAGIC ~ 1D Analysis
#MAGIC Buy gradually after successfully breaking through the resistance line of this pattern with a short-term target of at least 10%++

MAGIC Breaking Out – Next 100% Move on the Horizon?🚀 MAGIC Breakout Alert – 100% Potential Incoming?! 👀🔥
Hey Traders! If you're all about high-conviction plays and real alpha, smash that 👍 and tap Follow for more setups that actually deliver! 💹💯
MAGIC has finally broken out from a long-standing symmetrical triangle on the 4H chart — a classic bullish reversal pattern. After consolidating tightly, it's now flashing signs of a strong upward impulse! ⚡
📌 Entry: CMP ($0.200) and add more on dips up to $0.195
🎯 Targets: $0.25 / $0.29 / $0.33 / $0.39
🛑 Stoploss: Close below $0.176
⚙️ Leverage: 5x (Max)
✨ Previous breakout delivered over 100% gains — this one could be next!
Chart structure + volume looks perfect. If BTC stays calm, we might witness another explosive move in MAGIC.
💬 What are your thoughts on this setup? Drop your opinions below and don't forget to like & follow for more high-conviction trade setups! 💥

Magic Bullish Flag, Bullish Continuation = Multi-Year HighIt can crash just as it can move up. When I am saying it is going up this is only my belief.
When I looked at this chart I immediately thought that there will be a bullish breakout next because of the small rounded bottom and the bull flag, but, here is another scenario that can happen:
Then after I started to draw this scenario above seemed less likely.
» After a strong rise the retrace was very small.
» The support zone in blue matches the 17-March peak candle wick and close. It has been tested and it holds.
» There is no bearish volume nor any bearish momentum.
There is simply no need for the market to move lower and there are no signals pointing this way. So instead of down, a bullish breakout (continuation) comes next. Seems pretty obvious, the bull market has already been confirmed.
Thank you for reading.
Namaste.
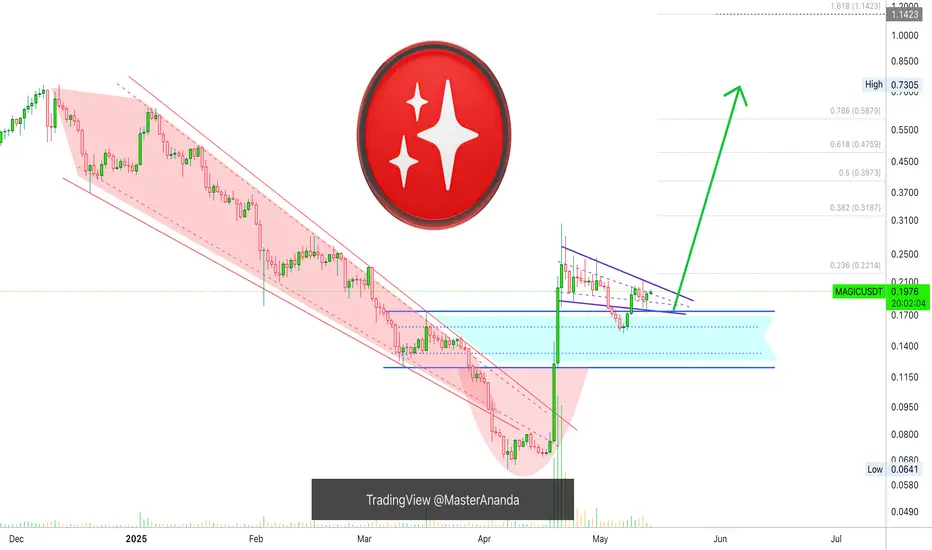

magicIt has a resistance in the red box that if it can break, it can go to the orange area. If it can't, it will be directed towards the blue lines at the bottom.

MAGIC Rebuy Setup (4H)This analysis is an update of the analysis you see in the "Related publications" section
The price didn’t reach our red zone for entering a Sell/Short position, but the trend reversal outlook on MAGIC was correct.
We are now looking for a potential Buy/Long position near the support zone.
We will only enter a Buy/Long position if the price touches the green zone.
Targets are marked on the chart.
A daily candle close below the invalidation level will invalidate this analysis.
For risk management, please don't forget stop loss and capital management
When we reach the first target, save some profit and then change the stop to entry
Comment if you have any questions
Thank You

#MAGIC/USDT#MAGIC
The price is moving within a descending channel on the 1-hour frame and is expected to break and continue upward.
We have a trend to stabilize above the 100 moving average once again.
We have a downtrend on the RSI indicator that supports the upward move with a breakout.
We have a support area at the lower boundary of the channel at 0.2045, which acts as strong support from which the price can rebound.
Entry price: 0.2060
First target: 0.2097
Second target: 0.2131
Third target: 0.2180

MAGICUSDT UPDATE
MAGIC Technical Setup
Pattern: Symmetrical Triangle Breakout
Current Price: $0.2253
Target Price: $0.290,
Target % Gain: 30.06%
Technical Analysis: MAGIC has broken out of a symmetrical triangle on the 4H chart with a strong green candle and volume spike, signaling bullish momentum and a potential 30% upside move.
Time Frame: 4H
Risk Management Tip: Always use proper risk management.

MAGIC – Building Energy for the Next Move?Hey traders!
#MAGIC has shown strong volume over the past few days, and now it's consolidating sideways – hovering just above a key support zone. This kind of setup often signals that a bigger move is brewing... but which way?
Here’s what we’re watching:
✅ Support holding firm – buyers seem to be stepping in around this level.
✅ Volume remains healthy, indicating continued interest.
✅ Price is coiling, setting the stage for a potential breakout.
📌 Our Plan:
We’re eyeing a breakout above the resistance level for confirmation of the next leg up. Once that happens, we’ll look for a retest of the breakout zone as our entry point for a long position – backed by proper risk management, of course! 💯
🎯 Target: Previous highs
📉 Invalidation: Clear breakdown below support
What do you think? Are you watching MAGIC too? Drop your thoughts, charts, or setups below! Let’s build together. 🔥👇
#MAGIC #Altcoins #CryptoTrading #BreakoutSetup #PriceAction #SupportAndResistance #VolumeAnalysis #TradeSetup #TradingView #CryptoCommunity

Magic chartMagic Jonson chart.
This is what I see when I smoke a hopeful blunt in the reality of society.
Don`t ask me how and why. It how the things work in my mind and universe.
Mega Long Opportunity on MAGICGreat opportunity on MAGIC with a tiny stop loss and amazing risk-reward. Target price: $0.70.

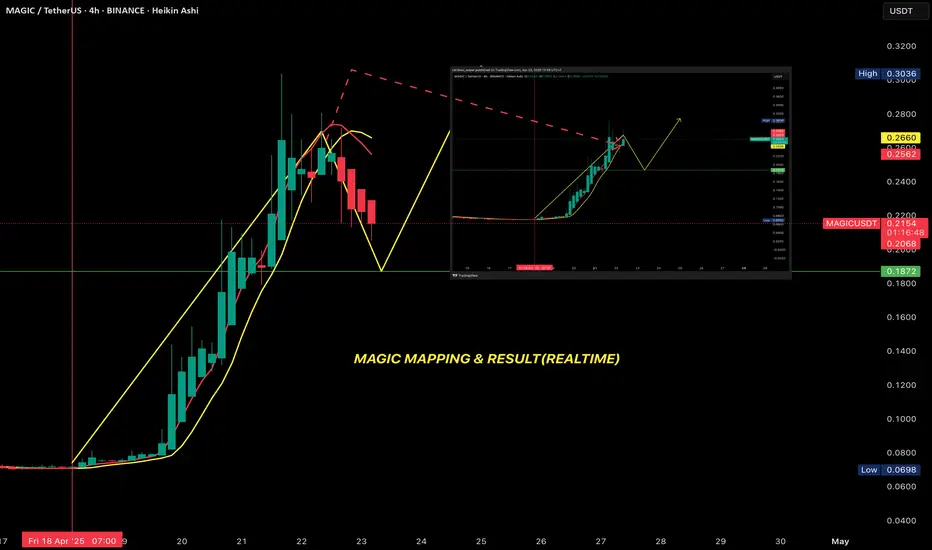
What is Mapping?The discrepancy between mapping and the real-time market is almost zero.
This is pure luck, nothing else.
What is Mapping?
Mapping is a method of projecting outcomes based on reading current and historical real-time data. To achieve accurate mapping results, you need a system that correctly identifies trends, accurately detects peaks and troughs, and clearly defines what constitutes a Swing and what constitutes Scalping, as well as what a test is, where the test occurs, where the peak price is, and so on. Among these systems, the trend-reading system is the most critical—it must be absolutely accurate for the other systems to function correctly. If the trend is misread, the other systems are almost guaranteed to fail.
Mapping is merely a projection based on recommended data for users who lack such a system. With this system in place, we don’t need projections or mapping. We can wait for results, proactively seek results, or monitor outcomes as they unfold to take action.
For example, if you want to buy MAGIC again, you must wait for the H4 timeframe to signal a bottom. When the H4 system indicates that MAGIC has formed a bottom, we know it’s safe to buy. If you buy before the H4 confirms a bottom, you’re buying too early, the price may not move, and you’re likely to hit a Stop Loss (SL).
MAGICUSDT The rally is a bull trap before the fallThe rally may be stopped in the zone 0.2633 - 0.2796.
An attempt to retest the upper resistance zone is possible, but the very fact of consolidation below these levels will confirm a false breakout, which may affect further decline
Scenario: false breakdown, consolidation below 0.2510 - 0.2633 with the purpose of continuing the fall
Short-term targets: 0.2173, 0.1700
Medium-term targets: 0.122, 0.071

MAGIC Sell/Short Setup (1D)The symbol MAGIC has started a strong momentum towards the Supply zone. Since there haven't been significant pullbacks during this powerful move, and the supply zone is fresh and untouched, a price rejection is expected. If the price reaches the supply zone, we anticipate a rejection and will be looking for sell/short positions within the supply zone.
Targets are marked on the chart.
A daily candle closing above the invalidation level will negate this outlook.
For risk management, please don't forget stop loss and capital management
When we reach the first target, save some profit and then change the stop to entry
Comment if you have any questions
Thank You

#MAGIC | Huge buy volume with 2.3 negative funding, Whats next? #MAGIC 2.2% negative funding and it's rapidly increasing. If breaks $0.261 level we will see $0.320 level next. Rejection around $0.261 is a huge selloff towards $0.203.

MAGIC- MAGICUSDT CHART ANALYSİSHow NFT Technology Developed
NFT technology was created in 2017 based on Ethereum smart contracts. Since then, we have witnessed many successful NFT projects and deals. Stories like these perfectly describe the current and future possibilities of the technology.
The development of blockchain technology and the emergence of NFT services coincided with other processes in society and the economy. Many new players appeared in the stock markets, including non-professional traders and amateur investors.
The democratization of financial markets coincided with the pandemic: being in self-isolation, alone with their devices, many people began to pay attention to new financial instruments.
The information that arose around them also played a specific role in the “revival” of NFTs. The big names in the news headlines supporting NFTs couldn’t help but draw attention to them. That is one of the reasons why the success of the technology was inevitable.

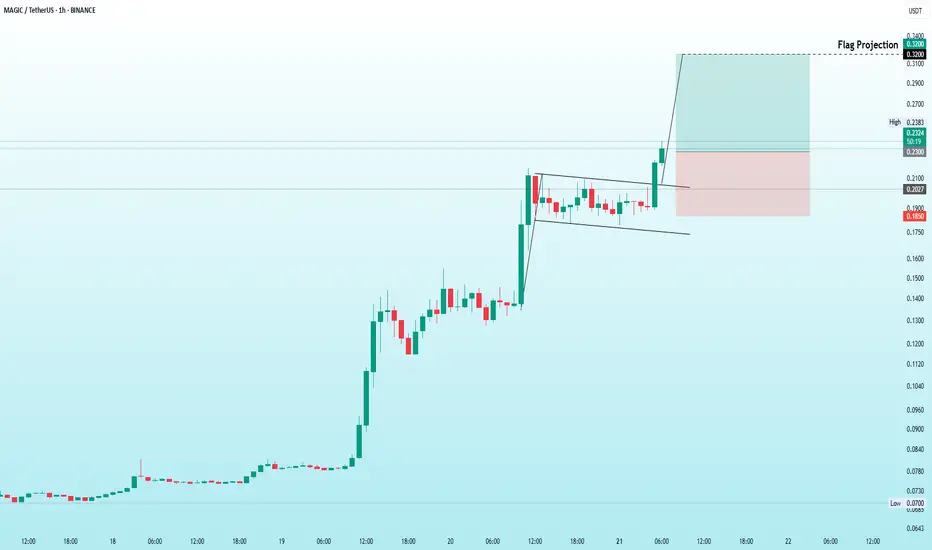
MAGIC | Flag PatternThe Flag Pattern breakout is already established, massive bullish rally on daily timeframe✅
Expected 36% bullish wave in coming days🎯🚀
Use stop loss at 0.185 just below the support.
Risk to reward ratio 1 : 2
#MAGIC/USDT Ready for a massive move!#MAGICUSDT : Classic Bull flag. Buy the retest after the breakout, or wait for the retest.
Or Accumulate in this range: 0.2140, 0.2040 ,0.1955, 0.1885
Target: 0.2164, 0.2278, 0.2324, 0.2445, 0.2489
SL: 1786
Dyor, nfa
#Magic
