Decentraland | Giant Harmonic Pattern Predicts Bullish WaveWhenever you have a bullish harmonic pattern, there is always a falling wedge at the end; thus, two bullish patterns in one.
Here we have this giant pattern, the bearish leg being almost three years old. This is coupled with a Doji last week, which hit a major support level (same as Feb. 2021).
The Doji coming at the end of a down move (very low volume after a three years long major low), can signal the upcoming reversal of the present trend. The trend is now bearish, lower highs and lower lows, so the reversal can lead to a bullish trend.
The bullish move can be big just as it can be small. Here I am mapping for you a safe target on this chart.
Expect fireworks to go off on the altcoins side of the market in the coming weeks. This will be the much expected bullish wave for the altcoins vs bitcoin pairs. Or maybe just the start, there is potential for these to grow long-term.
➢ Whatever happens, remember to do your own planning because; market conditions can always change.
Thanks a lot for your continued support.
Here we go again... After years and years of being together in this game.
Are you ready for some fun?
Are you ready for some profits?
Thank you for reading.
Namaste.
MANABTC trade ideas

MANA/BTC - Decentraland: BBand Breakout◳◱ On the $MANA/ CRYPTOCAP:BTC chart, the Bband Breakout pattern suggests an upcoming trend shift. Traders might observe resistance around 0.00001319 | 0.0000138 | 0.00001554 and support near 0.00001145 | 0.00001032 | 0.00000858. Entering trades at 0.00001287 could be strategic, aiming for the next resistance level.
◰◲ General info :
▣ Name: Decentraland
▣ Rank: 71
▣ Exchanges: Binance, Kucoin, Huobipro, Bittrex, Kraken, Hitbtc
▣ Category/Sector: Media and Entertainment - Virtual and Augmented Reality
▣ Overview: Decentraland is building a decentralized, blockchain-based virtual world for users to create, experience and monetize content and applications.
◰◲ Technical Metrics :
▣ Mrkt Price: 0.00001287 ₿
▣ 24HVol: 31.116 ₿
▣ 24H Chng: 8.151%
▣ 7-Days Chng: 17.82%
▣ 1-Month Chng: 20.64%
▣ 3-Months Chng: 88.67%
◲◰ Pivot Points - Levels :
◥ Resistance: 0.00001319 | 0.0000138 | 0.00001554
◢ Support: 0.00001145 | 0.00001032 | 0.00000858
◱◳ Indicators recommendation :
▣ Oscillators: NEUTRAL
▣ Moving Averages: STRONG_BUY
◰◲ Technical Indicators Summary : BUY
◲◰ Sharpe Ratios :
▣ Last 30D: 4.55
▣ Last 90D: 3.51
▣ Last 1-Y: 0.87
▣ Last 3-Y: 1.03
◲◰ Volatility :
▣ Last 30D: 0.75
▣ Last 90D: 0.73
▣ Last 1-Y: 0.83
▣ Last 3-Y: 1.62
◳◰ Market Sentiment Index :
▣ News sentiment score is N/A
▣ Twitter sentiment score is 0.57 - Bullish
▣ Reddit sentiment score is 0.71 - Bullish
▣ In-depth MANABTC technical analysis on Tradingview TA page
▣ What do you think of this analysis? Share your insights and let's discuss in the comments below. Your like, follow and support would be greatly appreciated!
◲ Disclaimer
Please note that the information and publications provided are for informational purposes only and should not be construed as financial, investment, trading, or any other type of advice or recommendation. We encourage you to conduct your own research and consult with a qualified professional before making any financial decisions. The use of the information provided is solely at your own risk.
▣ Welcome to the home of charting big: TradingView
Benefit from a ton of financial analysis features, instruments and data. Have a look around, and if you do choose to go with an upgraded plan, you'll get up to $30.
Discover it here - affiliate link -

✳️ Decentraland Trade Signal | MANABTC (120% Potential)Here you can find my trade signal for Decentraland vs Bitcoin, MANABTC.
These numbers are for reference only, can be used as a guide.
This is not financial advice.
Remember you trade at your own risk and the markets are unpredictable, anything can happen at anytime. Things can always change.
This setup has great risk reward ratio.
✔️ The risk is less than 8%.
If the trade goes bad the maximum you can lose ever, is 8% if you follow a plan/strategy.
✔️ Potential profits go beyond 100%.
That's the trick.
You don't have to win them all.
You just need to win big on the winners, lose small on the losers.
You can go beyond 100% of course that is up to you.
=========
ENTRY: 0.0000120 - 0.0000135
TP1: 0.0000148
TP2: 0.0000168
TP3: 0.0000200
TP4: 0.0000230
TP5: 0.0000250
TP6: 0.0000281
STOP: Close weekly below 0.0000115
=========
You do the clicking, you are responsible for your own actions.
I share these for my followers, adults, conscious people.
Trading is a game for smart people.
Some trades we win others we lose.
If you can't take a loss, then this game is not for you.
Always be responsible for any win as well as any loss.
The numbers never change if someone make a post.
If I post "Run! The sky is falling" yet the price remains the same, above the stop-loss, the trade stays active.
Even if I click "trade closed", this does not change the numbers.
Be smart.
It takes time.
We all make mistakes... From mistake we learn, we grow to get to that place.
There is a reason why we are trading.
There is a reason why we work.
We want abundance, freedom, prosperity and time to spend with our loved ones, don't you agree?
If that's the case, make sure to follow me.
Namaste.

✳️ 2021 Decentraland Produced A 4612% B.Wave -Next 2024 Or 2025?Looking just at late 2021 can be a bit misleading, here we can see that Decentraland (MANABTC) grew by 780% but this was only the last jump, the final wave.
When we go back to January 2021, the low, the total growth from bottom to top ends up being 4,612%... Now, that's Cryptocurrency for you.
I am mapping some potential targets but for the long-term and while the % is not as wild as before, these are big projects now, it is still great.
Smaller projects, newer projects, will surely have more room for growth.
The bigger the Crypto, the heavier it becomes.
For example, you can see Bitcoin growing some 6-8X, while some Altcoins can grow 15, 20, 30X. Obviously Bitcoin is many times bigger and thus it takes more capital for its price to grow.
When the full blown bull market starts to go, in 2024, our mistake is always understating the potential, not the other way around.
If you focus and hold for the long-term, you might end up seeing that I was wrong again... Instead of 6-9X, we can end up with 15-20X... That's Cryptocurrency for you.
The world is changing.
It is a new form of money.
Wealth is infinite... Cryptocurrency is new, everything can grow many times more than anything we can even comprehend.
I remember clearly just a few years back when people were continuously saying, "It is impossible, Bitcoin will never hit $5K".
Bitcoin trades now at $16,000 when it is super low.
Bitcoin trades above $30,000 today.
Even $3,000 seemed impossible at some point for the majority of the market... Do not be surprised to see Bitcoin going above $200,000 or who knows if higher after the halving takes place.
The year for Bitcoin is 2025.
The Altcoins will peak first, please keep this in mind.
Namaste.

✳️ Decentraland Low Risk vs High Rewards PotentialThis pair moved in January together with the rest of the market, the Altcoins and Bitcoin moving up.
We can surely see some similar action taking place this month.
We have a lower low 28-June and while the volume is relatively low 1-July, it is still the highest since January 2023, giving us a clue that some buying is taking place.
Lucky them that can be at the true bottom.
By the way, I was stretching and I hear "Mana"... I was like "Sure, why not..."
I've been working 24/7 that's for sure.
After a bearish wave, a bullish wave follows.
The signals are weak but the chart setup is great. It has a high potential for reward with very low risk.
Namaste.

MANA/BTC at historical support
MANA/BTC pair has been in a descending channel since Nov 2021.
Prices are touching the support trendline and are also at the historical ATL for the third time.
Two previous times when being at ATL, MANA had made 100% and 700%.
What will happen the next day/weeks to come?
Any catalyst to push the pair up?

✳️ 1,2, 1,2 Is The Final Proof | Decentraland, Patience Is Key! Decentraland (MANABTC) grew by 100% in 2 weeks.
If you had 1 BTC, you end up with 2 BTC.
Bitcoin grew over 65% in this same period.
Say 1 BTC was worth $10,000 for simplicity.
65% increase would mean $16,500.
Now your MANABTC trade doubles so you get $33,000 total (2 BTC at the new price).
That's why we trade Altcoins vs Bitcoin mainly long-term.
With USDT if you buy $10,000 worth of any Altcoin and it doubles you get $20,000. That's it.
Decentraland Technical Analysis
✔️ #1 is the falling wedge, after the falling wedge the bullish wave #2.
✔️ New #1 is a falling wedge ending in a higher low, new #2 should be a bullish wave ending in a higher high.
For all this... Patience is key .
Namaste.

#MANA/BTC - Long - Potential 50.41%Style: SWING TARGETS
Direction: LONG
Market: SPOT
Risk: 0.25% - 1%
Leverage: N/A
EXCHANGE: BINANCE
#BTC_MANA
TIMEFRAME: 360
ENTRY: 0.00002696
⎿ TP5: 0.00005392
⎿ TP4: 0.00004044
⎿ TP3: 0.000032352
⎿ TP2: 0.000029656
⎿ TP1: 0.000028308
STOP: 0.0000251
Move SL To 0.5% @TP1
Massive volume pump breaking month long downward trendline.

MANABTCThe MANA has two resistances at 0.00003309 and 0.00003527 and the Ichimoku cloud, before reaching its target. Highlight the MM200 which is a powerful magnet that is beyond the target, facilitating the ascent. Support has 0.00003019 imposed by Fibonacci. Mataverse tokens were dormant and undervalued, and there is already a positive movement towards them

Mana/Btc My RoadmapMana/Btc My Roadmap
Sell 0.000047
Buy 0.0000385
Sell 0.000045
in the short term after completing these three steps. I'll wait for the triangle to break

✳️ Decentraland Hit Bottom vs Bitcoin | Looks Great Long-TermThis chart looks so good that I had to stop to share a trade signal before writing this article...
So, what do we have here?
Decentraland (MANABTC) has gone through a massive correction/bear cycle.
MANABTC dropped by 83% from its All-Time High.
Now, altcoins vs tether (ALTSUSDT) pairs tend to correct by 93, 95 and up to 98% from major bullish cycles while the altcoins vs bitcoin (ALTSBTC) pairs are a bit different, they can correct 70, 75, 80 and up to 85%.
Some altcoins vs bitcoin pairs won't be go to 50% in its bear market correction while others move inverse to bitcoin and go bullish while the rest of the market drops.
Just a small detail to keep in mind.
Going back to Decentraland vs bitcoin, the RSI hit its lowest ever and is now starting to reverse.
As a bullish pattern we have a perfect falling wedge and a broken downtrend.
Early signals of the upcoming bottom came in November 2022 with a high volume week.. Afterward the volume continues to drop as the new low is hit.
With sellers exhausted this pair can change trend and start to grow.
Easy/first we will see a 75%+ price jump and hit 0.00003700 btc on the way up.
This will be followed by 230% at around 6880 satoshis or 0.00006880 btc...
We can even try an calculate the next high based on the Fibonacci extension numbers... This is what I see:
534% Possible (chart below)
That's it for Decentraland vs bitcoin... Very low risk, high potential rewards.
Remember to plan if you decide to buy/trade.
What would you do if prices crash?
Hold? For how long will you hold?
Sell at a loss? When would you sell, at which price?
What would you do if things go as planned and MANABTC breaks up?
Will you hold, yes? For how long?
Will you sell? When and how much?
Answering these questions will lead to maximum gains, reduced stress, controlled risk and long-tern success.
Quite simple isn't it?
Come and play this game.
Namaste.

MANABTCMANABTC It should leave the LTB in a short time since the selling forces are already in their externs. Its next resistances are: 0.00003153/ 0.00003604. She alone is worth the hold.

⚡️ #MANA/BTC - Potential 125% - Long ⚡️⚡️ #MANA/BTC - Potential 125% - Long ⚡️
#TRADEIDEA
Entry Conditions:
- Bullish Divergence
- Wave Reversal
- Nearing Bottom Of Trendline Support
- Descending Wedge
- Oversold
All targets & analysis displayed on chart
*These trade ideas are not tracked or official trades

MANABTC - Longterm IdeaI do see a possibility of a short (daily) run upwards. But this will not be the big rally. It's more a final top out and then we will go into a long consolidation phase to reach Wave 4 target zone.
But there is definitely a good chance to have afterwards in 2025 (not exactly) a huge big rally coming in for Mana again.
The big new bull market in around 2025 depends a lot when we go into a general crypto bull run again. Therefore also the weekly chart from BTC will help me to understand better the market cycles.

Decentraland Next Bullish Wave MappedFor Decentraland (MANABTC), we have a higher low long-term and prices moving above EMA300 and EMA100 today.
The last barrier for MANABTC is set around 0.00004510.
Once this level is taken out we can expect strong growth (green arrow).
Closing below this level would signal additional consolidation before the next bullish wave...
Additional details on the chart.
Thank you for reading.
Namaste.

Decentraland (MANA) formed bearish BAT for upto 18.50% bear moveHi dear friends, hope you are well and welcome to the new trade setup of Decentraland (MANA) with BTC pair.
Recently I shared a long-term trade setup for MANA, which is still in play:
Now on a 4-hr time frame, MANA has formed a bearish BAT pattern.
Note: Above idea is for educational purpose only. It is advised to diversify and strictly follow the stop loss, and don't get stuck with trade

MANA Complex Inverse Head and Shoulders Pattern We are seeing MANA printing a Complex Inverse Head and Shoulders Pattern on both MANAUSDT and MANABTC, once it breaks the neckline, we will have a very good trade opportunity with risk reward ratio of approximately 5:1
###NOT FINANCIAL ADVICE###

MANA AnalysisOn the left the USD pair demonstrates very bullish behavior, the 21SMA shows growth when in contact with the larger Gaussian Channel
On the right the BTC pair also shows some bullish transition behavior, in which a previous resistance has turned support.

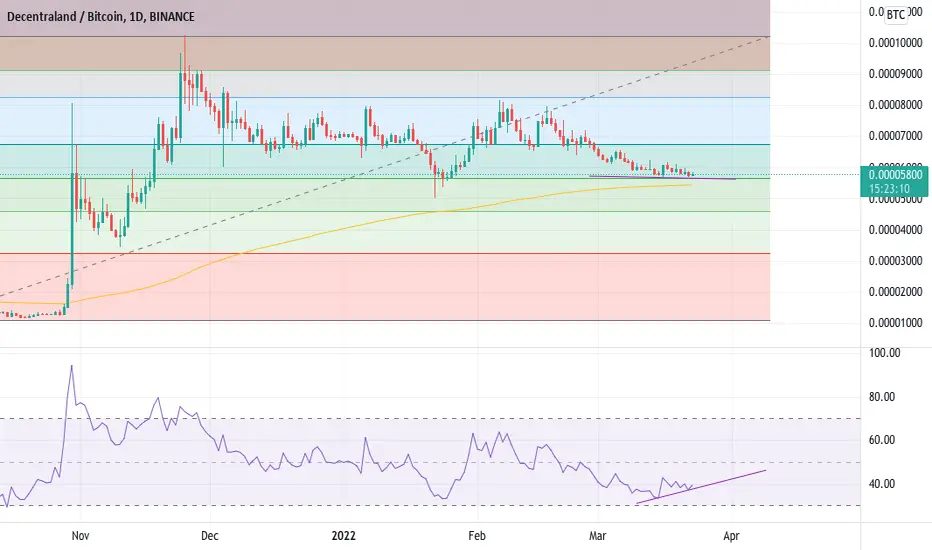
MANA/BTC pair at support?MANA/BTC pair at support?
Looks like theres a weak bullish divergence also, albeit the RSI did fully go oversold.
At the 0.5 fib not fib line lol, so the initial bull trend is still in tact.
also at the 200 ema which might serve up as support.
A Small Trade With ManaIn Very uncertain Market We have Small Trade for Trying
I am Not A Financial Adviser. And All Cherts Are Just My Study. So Please Do Your Own Search before open Any Trade.
If You Like My Work Just Come and Join Me.

MANABTCGeneral Guide:
1.) Anything above price is a resistance, anything below is support.
2.) Proceed with caution when taking a trade based off of this chart.
3.) Make a copy of it to watch it in real-time. Click the share button, then "Make it Mine"
4.) It is very risky to set limit orders, I advise you to set alarms and when it hits, check how it reacts.
5.) Watch the BTC pair closely as price will generally follow that pair.
6.) Definition of Terms:
Bearish/Bullish Order Block (OB) - Price rejects or bounces respectively.
(Monthly/Weekly/Daily) Liquidity - Where retail stop loss orders are.
pm/pw/pd/pr - Previous Month/Week/Daily/Range
VAH/VAL/POC - Value Area High/Low and Point of Control (70% of traded volume in a range)
OTE - Optimal Trade Entry
Rectangles - Liquidity Pools
Diagonals - Probably a Fib Resistance Fan, Pitchfork or Pitch fan
nPOC - Naked Point of Control
Eq - Price Equilibrium
Single Prints - Liquidity Voids

MANA BTC triple harmonic patterns gartley into double batsCool to watch this continue playing out, a little late posting this but you can see the power of the set up here that i identified in previous posts. Another bat pattern has formed, with a higher low, etc, its a bit late too take an entry here, but if you've been in this thing, it wouldnt be hard to imagine another harmonic printing and then leading to continuation. Once this thing gets above the next yellow line (inflection point) say goodbye!

Trade MANA/BTCNew Trade!
🏆 MANA/BTC
🏛 Binance
📥 Entry 0.0000794 (wait price to reach this level)
⛔️ StopLoss 0.0000755
⭐️ Rating 4/5
💰 Profit Goals #1 : 0.0000825 (Take 50%)
💰 Profit Goals #2 : 0.0000844 (Take 25%)
💰 Profit Goals #3 : 0.0000866 (Take 25%)
✨ When T1 reached: New Stop loss for remaining position moves to 0.0000763
✨ When T2 reached: New Stop loss for remaining position is entry point 0.0000794
📈
