Will the Bulls continue?In the past 24 hours, MANA has broken resistance, converted it to support, and is heading towards $3 after slight resistance at $2.88. Should bulls continue, MANA has a little resistance at $3.14, and significant work to do at $3.23, $3.90, $4.43. Many attribute MANA's initial spike because it "sounded" like Meta when FB changed names. This definitely brought attention to the asset, slid with Meta's recent earnings report but has since broken away into an ascending channel. The C&H pattern will break this short-term ascending channel, finding confluence with the 50MA around $2.98. It looks like BTC should be breaking $38k soon too. This is not financial advice.
MANAUSD trade ideas

It can go down to $0.56It can go down to $0.56.
Be careful. and wait.
It's just coming down from the peak of this cycle.

MANA 35%-56% Rally!If BTC behaves, nothing is stopping MANA from rallying 35% or 56%, depending upon which path it follows. I put the Fib chart up, as I think MANA will face some resistance at $3.31. The C&H has a target of $3.90 (purple). The target from the massive descending wedge is $4.41 (green), 56% above today's high and 73% above the breakout. These targets both line up with the resistance lines (red dot) that I drew back on January 3rd which gives some confluence to these patterns' formation. There may be some typical resistance around $3.50 as well. RSI is 53 on the daily chart, with plenty of room to run. MANA may test support at $2.50, top of the channel it just broke, before heading up? These are just ideas and not financial advice. I'm looking for BTC to break $40k and $42k to be a catalyst for this rally.

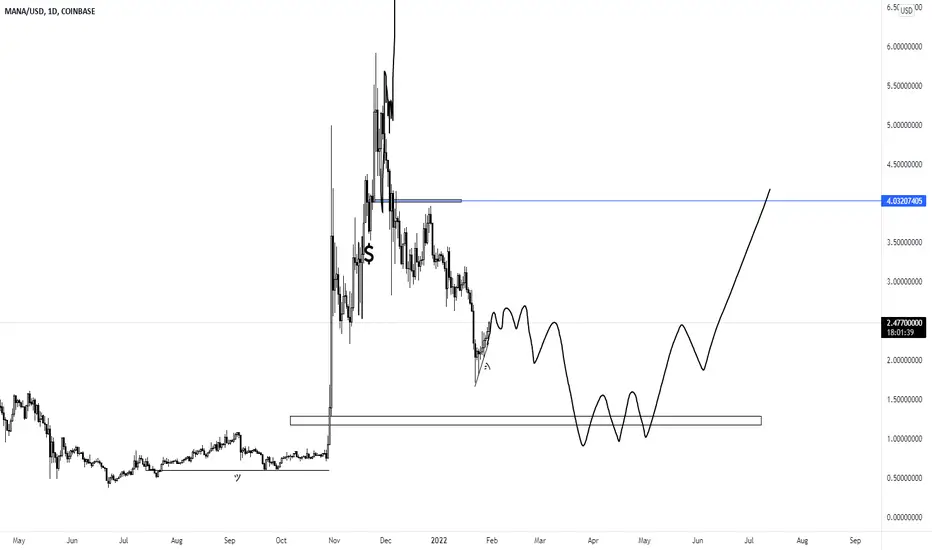
MANA By AcroScopicsI've been following MANA a while now and "found" a new potential up channel I've placed in Green on the chart,
Price had a nice run up from the last pivot low...whether it's the bottom or not I don't know.
But, price has fallen to the right, lower green channel line which also happens to be the 38.2% Fib Retracement Line.
I've been listening to a poster that uses a system that says that if the retrace ends at 38.2%, then the probability is higher price will push to a new high above the last pivot high.
Here's his link: www.tradingview.com I highly recommend!
RSI is declining sharply and is well under the RSI ma, so price would need to see an abrupt turn around for this current set up to be valid.
We'll see.

Lfggggg 50:1 crv woooWooooooo yes yes this is my description WW
Its needs to be longer wtf wtf wtf
Dhdhdjsthsu ffs rfbsshdhg
Thats why all my ideas are private
Ffs
And yes if it gets stopped i might go back in ladder


Decentraland shortDecentraland bounced off the descending trendline. Asset bounced off the resistance level. Decline to support level at 2.06 is possible.

Reversal signal!Taken a LONG position on MANA discovered a reversal signal which means we will have a bull run from here. Our stoploss is placed below the red line.

MANA - Bullish - Trade ReminderMANA Bullish and heading for TP1
30 days forecast = TP1
Like this idea ? ....Please do a thumbs up.
Thank you for watching.

MANAUSD Long Trade
MANAUSD Long trade opportunity just kicked off at $2.802 on the 7 Hour chart which is the best timeframe for my strategy. This recent bullish candle also broke the resistance line that started on November 25th.

MANA - LongMANA is about to hit TP1....
30 days Forecast = TP1
Like this idea?....please do a thumps up, Thanks for watching.

MANAUSDDaily Chart Analysis
MANAUSD has been making both lower highs and lower lows.
Was respecting 3.18 level and broke down from it and has now pulled back to it turning previous support into resistance. This is my entry cue.
Entry: 3.037
Stop loss: 3.31
Target: Trailing 20ema

Almost done with the right shoulder completion. MANA imminent. As I’ve stated across the board, MANA, like the rest, is currently perfectly drawing us a Head and Shoulders that spans quite some time. We are nearly to the last burst upward to 2.8-3.0 before the waterfall. Set stop losses. Do your due diligence. This is not financial advice.

MANA OUTLOOK 1-30-2022So we see mana has been dumping along with all cryptos and my thoughts now are that we are accumulating a whole lot of buy orders in this area we are ranging in to then accumulate to then distribute to the down side to fill the imbalance we have before going bullish again but there is a possibility we could sweep lows at .58 cents but i dont think it will happen, we could see a rejection when we come to the imbalance we have marked out so im going to wait for what information we can get these next few days before stacking some MANA.
Minor retrace to support?This chart reviews how we got to where we are today. The Inverse H&S reached its target then dropped to the Fib .382. I put my buy at the .5 Fib. slightly panicked, all for not. From last week's low to the .382 Fib, a new baseline has been drawn. MANA has formed a symmetrical triangle and broken out and is forming a smaller one now. There could be a short-term trend change forming in a bearish ascending wedge (BLUE) that would have a target, not coincidently, at the RED support line. I am keeping an eye on 3 moves.
1. breaking the upper BLUE line and continuing with the ascending channel...or failing and returning to RED line, wherever that may be.
2. breaking the lower BLUE line, finding support at the lower GREEN ascending channel and continuing higher.
3. breaking from the small triangle that is forming with a target of $2.50, which, not coincidently, lines up with the center of the GREEN ascending wedge.
4. This is not financial advice.

MANAUSD WeaknessThe cryptocurrency market as a whole is underperforming and MANA prices are being dragged down, with prices in a downward trend.
A variety of potential scenarios are shown in the chart.

DecentralandDecentraland (MANA/USD) just made a bullish cross SMA55/SMA233 on 1/29 at 5am 1hr chart. It did a bullish reversal since 1/22 at 5am with a double bottom bounce on 1/24 at 5-7am. Fibonacci VIP has been consolidating for 36hrs likely pointing to "Hodlers" positive impact on the price action. Here's levels on the 1 hour chart, 1 week view:
7 day high = $2.40
7 day low = $1.71
52 week high = $5.90
52 week low = $0.15
SMA233 = $2.24
SMA144 = $2.15
SMA89 = $2.24
SMA55 = $2.27
breakout = $2.64
R3 = $2.57
R2 = $2.50
R1 = $2.43
pivot = $2.36
S1 = $2.29
S2 = $2.21
S3 = $2.14
breakdown = $2.07
Do your own due diligence, your risk is 100% your responsibility. This is for educational and entertainment purposes only. You win some or you learn some. Consider being charitable with some of your profit to help humankind. Good luck and happy trading friends...
*3x lucky 7s of trading*
7pt Trading compass:
Price action, entry/exit
Volume average/direction
Trend, patterns, momentum
Newsworthy current events
Revenue
Earnings
Balance sheet
7 Common mistakes:
+5% portfolio trades, capital risk management
Beware of analyst's motives
Emotions & Opinions
FOMO : bad timing, the market is ruthless, be shrewd
Lack of planning & discipline
Forgetting restraint
Obdurate repetitive errors, no adaptation
7 Important tools:
Trading View app!, Brokerage UI
Accurate indicators & settings
Wide screen monitor/s
Trading log (pencil & graph paper)
Big, organized desk
Reading books, playing chess
Sorted watch-list
Checkout my indicators:
Fibonacci VIP - volume
Fibonacci MA7 - price
pi RSI - trend momentum
TTC - trend channel
AlertiT - notification
tickerTracker - MFI Oscillator
www.tradingview.com

Instead of bleeding,MANA is slowly nursing it's way back, one step at a time. The small triangle that just broke has a 13.5% price target which corresponds with the top of the ascending channel.

MANA 15 min charting patterns. Quick time frames.Trying to bring the fractal patterns all the way down to the lowest point. It is amazing the percentage of major transactions to minor transactions and these fluctuations. This is the adoptive strength governments are concerned about. I say We might be moving to a world where countries are defined by the price tag
and the service. It's 2022. Why squabble over land and religion. there is plenty.

Process of Elimination...Mana moving up!Yesterday MANA was showing three potential paths upwards, all ascending channels. Now we can eliminate the Blue and Pink channels, left with the green. WARNING: Should MANA hit $2.04 before rising to $2.28ish, I am keeping an eye on a Head and Shoulders pattern that would have a target back down in the $1.80's. Kinda hopeful for that because it would make a great trade...but not financial advice because it would be, in my opinion, a very risky trade. So, I have alerts set at $2.05 and $2.25, will reassess when one of them goes off. My hunch is that there seems to be enough support, leaving wicks on lower time frames, at the bottom of the channel (around $2.10 at the time of this analysis). Good luck. The Fed. seems inconsequential for the month ahead. BTC is still flirting with the $35k range.

MANaThis Quinn has the best price to buy due to the power of Quinn Mana Metavars in the near futureThis Quinn has the best price to buy due to the power of Quinn Mana Metavars in the near futureThis Quinn has the best price to buy due to the power of Quinn Mana Metavars in the near futureThis Quinn has the best price to buy due to the power of Quinn Mana Metavars in the near futureThis Quinn has the best price to buy due to the power of Quinn Mana Metavars in the near futureThis Quinn has the best price to buy due to the power of Quinn Mana Metavars in the near future

MANA holds steady. A little payday but not much play.This is a very interesting market. MANA followed the market with a little pre-FED speech. But not as drastic of a move. This coin is not in the top 20 but does have over 3 and a half billion market cap.

MANA is ready to begin ascending... finallyMANA is at the trendline that has held it down. Watch for a confirmed breakout. $2.30 is the level to watch
Good Luck
