MANA, rising from the bottom.The following content is machine translation:
In the 4-hour chart, the lower shadow line stopped falling and rebounded, and when it was blocked, it rebounded near the lower shadow line and broke through the small resistance.
MANA belongs to the Metaverse Dragon.
Operationally see more, target 2.8-3
MANAUSD trade ideas

Inverse Head & Shoulders or ?...MANA is completing an Inverted Head and Shoulders pattern with a price target of +15% (around $2.44). It should follow the Green ascending channel as it makes this rebound. It won't make up for the recent tank, but at least it is in the positive direction. Will it hold? We shall see. If MANA doesn't break out as the pattern indicates, I assume it will continue consolidating between an ascending channel between $1.87 and $2.30 as seen in the Blue ascending channel (or finding support around $2.07 and consolidating between that and $2.20 as shown in the Pink channel). Keep an eye on the 50MA in relation to the 100MA...they're beginning to flirt a little bit with only 1.8% separating them. We do not want to see them cross over on the daily chart. On shorter time frames, this relationship looks a lot better. Since there has been an extended downtrend, it is only natural that the 50MA and 100MA are getting so close. MACD looks fine and of course, the Stoch RSI is rock bottom, which indicates less selling pressure.
In the end, it all comes down to BTC. BTC is not forming an Inverted H&S but is moving in a positive direction. I am keeping an eye on BTC breaking $39k. Should BTC get rejected there, besides the normal resistance, BTC will continue forming a bearish ascending wedge, giving BTC a return to the $31k range, undoubtedly dragging the market with it. Sit tight as finding support at $29-$31k is healthy and has been expected for several months. Should BTC break $39k, the next level to break is big @ $42k. I would actually prefer to see BTC test $35250ish first, creating more of an ascending channel versus trying to break out of an ascending wedge. This isn't financial advice. Good luck. Also note that MANA will sometimes break away from BTC for short periods so this short-term potential 15% increase may not be affected should BTC explore $35k. That being said, what BTC does between $29k and $31k will definitely affect the overall market. If BTC bounces, so will MANA, if it loses its footing at $29k, I anticipate MANA dropping to $1.25 or even lower to around $0.95. Again, not financial advice, just what I am reading from the chart for a potential short-term recovery, including an equally realistic path to lower numbers.


What's the big deal?A big part of trading in the crypto space is patience. As more technology is developed and BTC becomes more antiquated in comparison, the growing pains are par for the course given that ALTS are still attached, using BTC price as an indicator. I also don't think it is going to be as bad of a transition given Intel's new chip on the horizon? The metaverse is seeing huge institutional investment and MANA is just beginning. How it reacts to the overall market is indicative of a "newish" token. There isn't a lot of data to offer support in the current price range so it really comes down to BTC. I've been wanting BTC to hit $29k for months...just to get it over with. It may bounce off $35k in the next day...or continue down towards 29-30k? I don't see these dips as "crashes," just the evolving pattern that is still very much intact.
In previous downtrends that lead to the ominous Crypto Winters (so dramatic), this industry was super speculative without a whole lot of understanding of the technology being developed, near zero adoption, and certainly lacking clear vision as to the potential of the space. People are beginning to understand, adoption and innovation is beginning to flourish. Nations and big businesses are looking toward blockchain for real solutions and industries are building in the metaverse. Today's chart is to just chill everyone out. 56% drops seem to be the magic number before a rally. The "fake out" on Jan 15/16 was disappointing but to no fault of what's actually happening in the metaverse space. Some analysts are calling for $1.5...why? Just because it was where MANA took a breather on its ascent to $5? That's stupid. What is MANA worth? I have no idea as to its intrinsic value. I do know that companies like Adidas, Nike, Samsung have done their research and feel it is worth something. We don't know where the bottom is and as I've said this before with ADA, anything under $2 is a bargain. Even at $1.50, MANA's price would still fit into the bullish descending wedge in the next few days. A drop to $1 would turn that wedge into a channel and trigger the bots to do their thing, bringing MANA back above $3 or even $5 in the short term. I used to say the same about ETH with $200, then $450, and then $2500 within a year's time...each bargain prices. It doesn't so much matter where you buy as much as where you sell. To freak out is to think MANA will never hit $6. If you don't think it will, why did you buy at $4.35? Crypto is going through its cycle and the world is watching more than ever. I'm also not worried about Biden's regulations. As much as I'm not a fan philosophically, I think it will ultimately be good for crypto investors, offering slightly more security which will lead to more innovation and adoption. Also, besides this not being financial advice, know that there are so many unknowns. People will figure out the advantages of anti-inflation and buy versus sell when the news of inflation tanks Wall Street...so yeah, some things are counterintuitive as this industry grows and people will catch on as they become more educated.

MANA - Right At Resistance! What's Going To Happen Next?Happy Money Monday, Traders!
Hope you find value from this post.
If you did, pls like and consider following.
Here's a trading idea.
But firstly...
==============================
Quick Disclaimer:
Trade at your own risk. This post/chart is for your reference only, it is not intended as a recommendation, nor is it an advice to sell nor buy this crypto asset, nor to place any trade.
Trading poses a risk of losing some or all of your money and it will be your responsibility if you lose money.
==============================
MANA broke the Blue Horizontal Support Bar which has now turned resistance against MANA.
MANA is right up at the Red Resistance Extended Trend Line and will react to it today.
What's next for MANA?
A. Further dipping could bring MANA towards the 1.7090 which was previous support 2 days ago.
Breaking the Green Horizontal Support Ray Line could push MANA down to the $1.272 @ the 1.136% Fib level.
B. MANA could consolidate (go sideways) from here meet up with its 21MA.
C. MANA could now push out upwwards escaping the Red Resistance Extended Trend ine and meet the 21MA. It either could breach the 21MA and re-test the Blue Horizontal Bar.
MACD: Bullish Divergence .
Stoch RSI: Oversold Region, has a bullish momentum.
Price action is KING!
Always remember to place your Stop Loss.
Patience and Discipline are KEYS to a successful trade.
Trading is both a Science and an Art.
Develop an intuition and listen to your instinct while following the rules putting emotions aside.
If you have not yet developed it, you will develop this as long as you stay consistent with following
the rules. The skills will become second nature to you much like how you acquire the skill in riding a bicycle.
Soon it will be your subconscious running your trades, again, much like when riding a bicycle
the balancing is controlled by the subconscious part of your brain.
Be PERSISTENT and stay PERSISTENT.
Let me know what asset you wish for me to look at and evaluate for potential long set ups and I will post it here on TradingView.
If you found value from this post, consider giving it a like and subscribe. Furthermore, share it with someone you know will benefit from this.
More power to all your trades, my friends!
Ron
Intrepid_Trader

MY MINIMALIST CHART ANALYSIS FOR DECENTRALAND01 .21.22
1224H +8 SINGAPORE
Disclaimer:
The findings of the following analysis are the sole opinions of the publisher of this idea and should not be taken as a piece of investment advice.
This will be a good season for ENTRIES. The market has found strong support at a very bargain price for cryptos.
We will be focusing on BITCOIN and ETHEREUM as our TOP CRYPTOS. As for ALTS, ADA, POLKADOT, MANA, SAND, CURVE, MATIC, and a few others.
Basically, the outcome of BITCOIN, the ALTS tends to follow. So I am limiting my published ideas to a few, quality over quantity.
ALERT:
Looking now for an ENTRY to a short to midterm LONG SWING trade.
It did hit our forecasted bearish FIB 0.618 and our measured move. On our way to a reversal of trend anytime.
Based on VITAL SIGNS ( RSI, STOCH, VOL., MA VOL.) Looks healthy:
1. RSI still midway down
2. STOCHS towards LOW
3. Volume still needs a spike of SUPPLY for BUYERS to TAKE, but I am afraid a lot of HODL at this point.
4. Looking at support at 2.5 zone
5. We can then expect a strong support at the 2-2.5, right at the bottom of the MAJOR BLUE BOX, MINOR YELLOW BOX and the ENTRY AREA OF VALUE MARKER.
Hoping that the market does not break any MAJOR or MINOR BOTTOM of our BOXES. Again, if it does, it will be a BUYERS MARKET and good for us all RETAILERS.
Looking back months ago when the MINIMALIST BOX ANALYSIS was made.
The Market had amazingly moved along the TOPS and BOTTOMS of our BOXES, signifying TURNING POINTS of PRICE ACTION, and verified by major FIB levels.
Hoping that this MINIMALIST BOX CHART ANALYSIS will efficiently help you with your DYOR as we climb a NEW SWING CYCLE.
INSTRUCTIONS:
HOW TO USE THIS MINIMALIST CHART a.k.a (Bento Box)
"FOLLOW THE WHITE RABBIT!"
Just Follow the TOPS and BOTTOMS of the BOXES as a GUIDE where the MARKET will take you.
PUBLISHED IDEA is created on a MONTHLY, WEEKLY & DAILY Analysis of a MARKET'S CHARACTER.
It is designed for SWING TRADES at the LOWEST or START of a SWING CYCLE.
Q/A : What are the BOXES for? It is a ROAD MAP for TARGET ZONES IDENTIFICATION.
The LARGE BOXES (Tops and Bottoms) are MAJOR turning points that will occur sometime in the future. While the SMALL BOXES (Tops and Bottoms) are MINOR turning points.
These can be entries to a BUY/ SELL POSITION, EXIT/PARTIAL EXIT/TOP-UP AREAS, as well as Support and resistance levels
Also includes MAXIMUM TARGET EXIT AREA OF VALUE - CONSERVATIVE (If price action conditions are right at that given moment.)
If it cannot break a TOP or BOTTOM of a BOX, It signifies a reversal.
At times I will include a WAY BEYOND PARABOLIC PRICE TARGET, depending on The Character of the Market (CRYPTOS ONLY).
DYOR for your Volume , Chart Patterns, Candlestick Math, FIB COILS, Price Action, FIB LEVELS, Market Dynamics, especially institutional and retailer trading psychology .
Stay away from FOMO and FUD.
NOTE: That PRICE TARGETS for ENTRY and EXITS are DYNAMIC and can CHANGE from time to time.
My Published Ideas are not 100% Accurate. There are many factors at a given time that can change the forecast.
It is all based if the right conditions are met. Generally, it will follow the MINIMALIST BOXES.
Wishing you all The Best Trades and Thank you all for your Appreciation and Support of my work.
Much thanks to my 3 great mentors. They are so much of a blessing that I also wish to share my knowledge of what I was taught.
Vive Le Autist!
Vive Le Diamond Hands!

Mana to $17.30 !!!We are at the bottom now at $1.94
Previous 3 rallies pumped the coin 3000% 3000% 900%.
Using the most conservative rally of 900% we can expect the price to shoot to $17 soon.
Get in while its on sale.
Someone elses worse day is your opportunity. Lets do it
COINBASE:MANAUSD

Mana.x going to $13COINBASE:MANAUSD has previously retrace ~78% from its highs over and over again.
We are at the bottom now at $1.94
Previous 3 rallies pumped the coin 3000% 3000% 900%.
Using the most conservative rally of 900% we can expect the price to shoot to $13 soon.
Get in while its on sale.
Someone elses worse day is your opportunity. Lets do it

$MANAUSD heading northThough risk is high, the reward looks good. I am long term bullish on $MANAUSD.

will it go up ?if MANA hit does three support i believe that it will go half or retest the previous resistance at $3.5.. does it long like promising ?
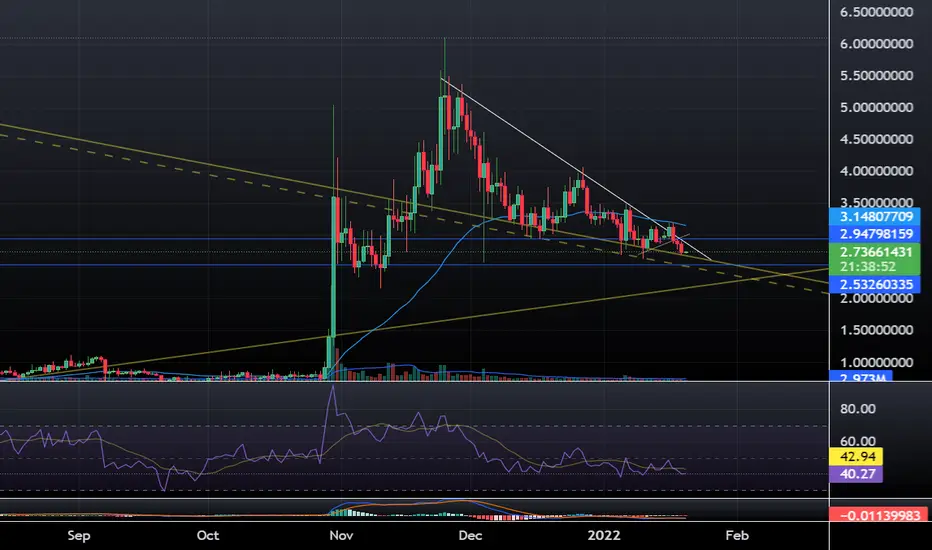

Incoming Trend Reversal ConfirmationZooming in on the Daily chart to 2 and 4 hours, Mana broke out of the descending wedge and retested the bottom of the ascending channel, attempting a reversal in trend. Should it break through $2.96, there is nothing keeping it from entering the mid $3.20's for the first time in 10 days. Depending upon volume, there is always minor resistance at the middle of the ascending channel that sometimes sends it back down to the support before heading up. Volume is still low, any increases as of late have simply been a small number of people shorting the small bumps, which is totally fine (I do it because trend reversals need to set up first to have a meaningful move higher and is oftentimes more predictable). You'll notice that when it simply bounces, w/o a set up like on January 5-6 (28% in 16 hours) it gets rejected just as hard in the following day(s). But, this was an indicator that a trend reversal was inbound and that's where we are at, looking for a confirmation of the break-out in the coming hours. These are just the ideas that I am reading on the short-term chart and not financial advice. The MACD is not looking fantastic. Mana is back at the baseline of the Stoch RSI, supporting another attempt at moving higher...or at least not moving much lower. What we don't want to see is a close below $2.90 as that could lead to a short-term test of $2.50 area. The long weekend is coming to an end and I anticipate some higher volumes tonight and into tomorrow. As always, keep an eye on the Fed. news, BTC movement, and how Wall Street is trending. Keep a stop loss...still very volatile. Mine are a little loose right now because volatility goes both ways. Good luck.


selby_exchange - MANAUSD- Selby Decentraland Fibonacci TestSelby Decentraland Fibonacci Test
MANAUSD
January 16, 2022 - April 09, 2022
"Fib Test"
Custom Fibonacci Retracement Levels
Support of 1.333 or Above is Long Entry
Rejection of 1.111 or Below is Short Entry
Bull Market Continuation is Support of 3.666
Selby finding creative patterns in charts on Tradingview
Not advice for investing, but I am one to watch
Rebellion=Change=Future

Decentraland (MANA): Falling wedge breakout!!Decentraland is currently breaking out of a falling wedge pattern. Price target is $5.61. The daily MACD oscillator just turned bullish for the first time since December 2021.

MANA Watch for impluseMANA is looking ready to run. IF the WHITE trend is broken look for PT at $3.20 and $3.40
1H RSI is elevated, so if break doesn't happen soon, this may take longer to develop. Set alert for that trend break.

Manausdt moves forward.Mana needs to break out the resistance at 3.03 and closes a candle over 3.10. Then get the TPS as marked on the chart.

A week later, same chart.Be patient. The market made it through the Fed last week. MANA has just been filling in the lines this week. Super low volume. MACD looks good on multiple time frames, pointing up on the daily. BTC 50 and 100 still don't look great...but MACD is good. We'll see what BTC does at 48K?


MANAusdt longSomething is cooking
Waiting for a clear breakout on the 4hr TF then probably go long on a retest
Sl below the trend line near
Let’s see how things turn out
Tp 3.1-4
Or TP as greed permits
Use proper risk management
Nothing is 100% certain so trade on your own detriment
And lastly NFA
Stay tuned

MANA USD : Looking Attractive Now This is now at bottom of the Darwas box after witnessing
strong correction. The risk reward for this trade is quite favourable.
Rate of change indicator is also at support.


MANA - Rejected At The 12MA, Still Below Resistance Line Hope you find value from this post.
If you did, pls like and consider following.
Thanks.
Here's the trading idea.
But firstly...
==============================
Quick Disclaimer:
Trade at your own risk. This post/chart is for your reference only, it is not intended as a recommendation, nor is it an advice to sell nor buy this crypto asset, nor to place any trade.
Trading poses a risk of losing some or all of your money and it will be your responsibility if you lose money.
==============================
MANA could not break through its 12MA and continues to stay under the Red Extended Resistance Trend Line.
Retracement now could bring MANA back down towards the Green Horizontal Bar.
Further push to the downside will bring MANA towards the Purple Support Bar 2.48 to 2.21
Today's first order of business is to find support at 2.8 or down at the Green Support Bar at 2.7 - 2.6.
MACD: Histogram - Bullish Divergence.
Stoch RSI: Bullish Divergence.
Always remember to place your Stop Loss.
Price action is KING!
More power to all your trades, my friends!
Ron
Intrepid_Trader
