MANA Reaching a Stall According to the recent behavior of Mana (decentraland) price. An abrupt increase on price has been followed by stabilization.
This decreasing stable condition invites to believe that the coin has grown steadily to maintain its position, growing up on holding capital to maintain the same value.
This stability tendency, i believe, will end as MANA decides to improve its value by increasing its participation on the market by new liaisons and activities to attract investors.
Unfortunately for MANA, its price will probably depend on the social factor in the future. It is time for MANA to think about what to do to increase the perception of VALUE.
***NOT A FINANCIAL ADVISOR, PLEASE DO YOUR OWN RESEARCH***
MANAUSD trade ideas


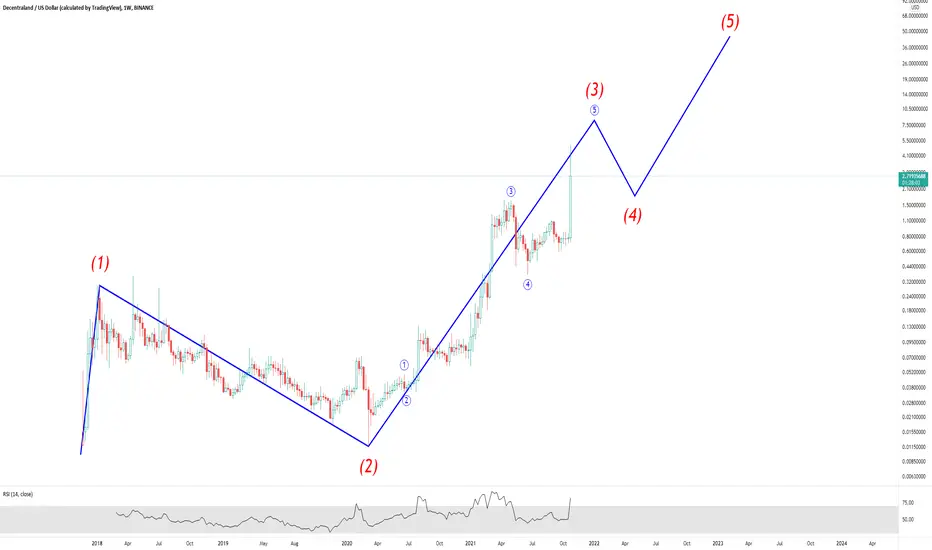
MY MINIMALIST ANALYSIS FOR DECENTRALAND $MANA (ADJUSTED CHART BASED ON CORRECTION from PARABOLIC)
11.02.21
1246H +8 SINGAPORE
ALERT: ENTRIES, PARTIAL EXITS, EXITS, and MAXIMIZED AREAS OF VALUE
THIS IS AN AREA OF OPPORTUNITY: WITH THE SUCCESS OF OUR FIRST SWING, THIS IS A ZONE OF ENTRY FOR A SECOND SWING.
THE MARKET IS FORMING A COIL ON A BULLISH TREND.
It has further attracted BUYERS and fueled further upward momentum. FOMO is still on the rise turning out to be positive for this MARKET.
Price is still at a bargain, considering, $MANA is comparable to $BNB.
You may want to TOP-UP for this, and to those who have missed out on the First Swing, here is another chance. Roughly 150% gains on MAXIMIZED TARGET AREA OF VALUE.
HAPPY TRADING AND ENJOY THE WEEK!
Disclaimer:
The findings of the following analysis are the sole opinions of the publisher of this idea and should not be taken as a piece of investment advice.
"FOLLOW THE WHITE RABBIT!"
Follow the TOPS and BOTTOMS of the BOXES.
HOW TO USE THIS MINIMALIST CHART
Created on a MONTHLY, WEEKLY & DAILY Analysis (The Dynamics of the Market.)
It is designed for SWING TRADES at the BOTTOM. I do not SHORT, though, you can still use it.
TARGET ZONES IDENTIFICATION
The LARGE BOXES (Tops and Bottoms) are MAJOR pivot points that will occur sometime in the future. While the SMALL BOXES (Tops and Bottoms) are MINOR pivot points.
These can be entries to a BUY/ SELL POSITION, EXIT/PARTIAL EXIT/TOP-UP AREAS
and if you wish to hold longer for a MAXIMUM TARGET EXIT AREA OF VALUE -CONSERVATIVE (If price action conditions are right.)
At times I include WAY BEYOND PARABOLIC Price TARGETS depending on The Character of the Market.
Watch out for your Volume, Chart Patterns, Candlestick Math, FIB COILS (ABC), Price Action, FIB LEVELS, Market Dynamics, and especially trading psychology.
Wishing you all The Best Trades and Thank you all for your Appreciation and Support of My Work.
Much thanks to My 3 Mentors!
Note:
Master your Trading Discipline
and Trader's Psychology
Vive Le Austist!

DECENTRALAND CRYPTO : CMP 3.20Trading in open sky zone....these CRYPTO rally almost 500 percent in last 7 days....can hold this position with SL 2.75

$7 ????If it stays above $3.5, it has the potential to double and hit $7. Keep watching and happy trading. Welcome to metaverse.

MANA NEUTRAL LONGI think that mana has done its first major run and needs to cool off a bit. i won't be entering until i see some movement out of the pennant.


MANA/USD Crypto that can give 300% returnsthe coin has already given massive returns and now it still again getting ready to blast, just ride the trend


$MANA Bullish symmetrical wedgeA great looking symmetrical wedge on $MANA. This is a more macro weekly chart view. Will probably take a few weeks to pan out but structurally looking positive. RSI and MACD starting to reverse.

Bullflag on MANAHi all,
Pleaese not this it no financial advice but just my view on how the MANA chart is developing itself.
Despite a small decline it looks like MANA is actually forming a big bullflag. It looks like it has just broken out and made a pullback to the flag. Based on this pattern I expect that a further increase can be expected.
I have shown on the chart where and how I expect this chart to develop, but with these crazy increases you of course never know.
Good luck!

MANA to 3.86I have MANA trailing SANDs moves by about 30 minutes. So I'm using it as a leading indicator

Another large upmove on cards for MANAUSD?BINANCE:MANAUSD is nicely consolidating in a triangle. If it breaks out on the upper line then we might see another wild move. Definitely keep an eye on this one.

MANAUSD Descending WedgeA descending trend line since the ATH yesterday is visible on the hourly chart with multiple spikes occurring due to pump and dumps and/or covering of short positions (though I have not done enough research on short interest on MANA - likely bag holders are exiting positions with each new spike). $2.557 seems to be a crucial price of supply meets demand since October 30. Combine this price with the aforementioned descending trend line we see a descending wedge forming.
I anticipate a breakout from this pattern in the next few hours. A breakout down might imply further sell off to $2.1533, then further to $1.69. This collapse may be interrupted by the larger, bullish trend (which, from my interpretation, began on October 28). On the other hand, a breakout up may be met with supply/resistance at $3.43, from where a parallel channel may form (with $2.557 being support/demand zone) until the next large influx or efflux of volume. A breakout above $3.43 may imply further price movement toward $3.887, then potentially a retest of the ATH ($4.99).
The price targets I provide are my own anecdotal opinions and I observe them making room for error.
Regardless, volume is dying. The hype is waning. MANA volatility may wane similarly to other meme assets such as DOGE and GME. The purpose of this post is so future me learns from what I theoretically predict and what actually occurs.

MANA ! Wealth Creation. Swing Trade Idea!Mana is looking like it’s getting Support on MAon smaller time frame.
Don’t miss out this bad boy!
Falls In our research on swing set ups with a good ratio of Risk and Reward.
As always we put quality over quantity, don’t forget to follow us for SWING trades research on risk and Reward Ratio.
Subscribe and don’t miss out next research.
Swing trading is great because you can create a lot wealth in % by risking less $$. Compound Gains.
Thank you for the Love, I really appreciate those likes, makes a difference.

Big Plot.have looked over long term counts and this is what appears to be the most accurate imo, probable path is clearly up with some turbulence along the way. Yes it's possible we can still 10x again from current prices, Previous call has already been a 10x check below.
puulback neededi might buy if it pulls back
i dont wanna get stuck on this pump will wait for prices to come down BIT FIRST

pulled back as per my last post i bought on the dip and expecting high consolidation into this forming flag before a major squeeze

$MANA another great entry Buy Long!Decentraland is at another great buy area after breaking from its resistance.
MANA !!

MANA - STRONG BUY - $4.62 - $3.15MANAUSD - STRONG BUY
Target: $4.62 - $3.15
Extending Wave 1
Learn More: decentraland.org
FMW

Mana - Descending Channelcontinuing to monitor this at the metaverse will likely be a thing. I guess I prefer the great outdoors for my relaxation time, probably due to enough time spent in a metaverse of my own design, the 3D Markets.
