MANAUSD trade ideas

MANAUSD D1: 150% gains THE BEST LEVEL TO BUY/HOLD(SL/TP)(NEW)Why get subbed to me on Tradingview?
-TOP author on TradingView
-2000+ ideas published
-15+ years experience in markets
-Professional chart break downs
-Supply/Demand Zones
-TD9 counts / combo review
-Key S/R levels
-No junk on my charts
-Frequent updates
-Covering FX/crypto/US stocks
-before/after analysis
-24/7 uptime so constant updates
🎁Please hit the like button and
🎁Leave a comment to support our team!
MANAUSD D1: 150% gains THE BEST LEVEL TO BUY/HOLD(SL/TP)(NEW)
IMPORTANT NOTE: speculative setup. do your own
due dill. use STOP LOSS. don't overleverage.
🔸 Summary and potential trade setup
::: MANAUSD D1/candle chart review
::: HIGHER RISK SETUP USE TIGHT STOP LOSS
::: further losses short-term
::: expect BEARS to target 60-65 CENTS
::: however strong bounce after correction
::: setup still valid as of today
::: chart is LOG SCALE
::: get ready to BUY LOW later near 60-65 CENTS
::: BUY LOW near 60-65 CENTS Dusing tight SL
::: currently correction in progress / no upside
::: dump until MERGE EVENT
::: for now stay out / wait for better entry price
::: up to 155% gains possible later
::: short-term pullback/correction
::: is possible / likely
::: however chart looks good for BOUNCE
::: SPECULATIVE SETUP
::: do your own due dill
::: and use proper risk management
::: TP bulls is +155% gains
::: details: see chart
::: FINAL TP is +155%
::: recommended strategy: BUY/HOLD 60-65 CENTS
::: TP BULLS +155% gains / 1.50 USD final TP
::: SWING TRADE: BUY/HOLD IT
::: bull run not over yet
::: good luck traders!
::: BUY/HOLD and get paid. period.
🔸 Supply/Demand Zones
::: N/A
::: N/A
🔸 Other noteworthy technicals/fundies
::: TD9 /Combo update: N/A
::: Sentiment mid-term: BULLS/STRONG BOUNCE
::: Sentiment short-term: CORRECTION/65C
RISK DISCLAIMER:
Trading Crypto, Futures , Forex, CFDs and Stocks involves a risk of loss.
Please consider carefully if such trading is appropriate for you.
Past performance is not indicative of future results.
Always limit your leverage and use tight stop loss.

MANAUSD - ONE DOLLAR BOB!I'm Tellen ya, don't say i did not tell ya. Put on your tinfoil hat cuz here it goes. Meta has interest in keeping MANA as close to $1 as possible and they have the marketing budget to do so.

Juicy retest on $MANAThe market is currently offering some huge opportunities on certain Alts.
After a decent break-out, MANA is currently retesting the previous resistance zone.
That gives us a wonderful place to manage our risk.
Are you long too?

Decentraland (MANA) sending mixed signals for AltsMANA 1D has been forming an ascending triangle in downtrend as opposed to the more common formation during an uptrend.
To form this pattern you need an initial rally where price action begins to consolidate between a flat resistance point and rising support trend line before continue on.
Unlike in an uptrend, when the ascending triangle pattern develops during a downtrend it’s more likely to signal a reversal than a continuation.
Very rarely will the pattern form perfectly and in the current market conditions we have seen many fake outs and overthrows across most coins so always look for confirmation.
How to trade this pattern:
Go long on resistance break out but only after confirmation.
Go short on support breakdown but only after confirmation.
With that being said it's seems more favorable for the bears that we would see a breakdown of support as the prevailing trend is downward and can often lead to resistance holding. With pattern trading or candlestick patterns its always wise to use another tool for confirmation of your analysis. Something such as the RSI can improve your odds of succes.

MANAUSD: Bullish Above the Daily TrendlineMana is holding above this Daily Trendline and the 55 day Moving Average; So long as it can hold theselevels we should see it eventually Break Free from this range and see higher prices at the next highest resistance likely near the $2 mark.

MANAUSD The META train baby!Hey Nerd! Don't mess this trade up for all of us. Just pretend you never saw it or tell everyone you saw it here first. I don't care, you most likely don't have the volume needed to keep it at $1 anyway... guess who has the volume.

When market gives us worries we need to HedgeHi everyone,
so market is taking another turn and we need to act and react.
Do we panic and sell all our spot? Well if you think yes then you must have already paid the price a few times and haven't learned yet. Needless to say that if you are in this category you probably didn't take profit either when you should had. That's what happens to most, yes.
In this cases one can think like this:
Leave my spot intact and cover my exposure with a short position on some assets.
Look for a chart under resistance and plan accordingly.
Hope you like the chart.
One Love,
The FXPROFESSOR
For me that chart now is Mana.

Coming back to chart analysis.Looking at the chat I'm seeing an entry once it crosses 1.15.
Let me know what you think.

MANA Ready for 1.10After the recent drop from the resistance at 1.02 mark due to a profit-taking interest, it looks like Mana has found a good support at 0.85 and buyers are getting in to push it to the next target of 1.10.

Looks bullish... 1.50 soon?Looks bullish and waiting to lift off. May be some pending news will do the magic run.


On The Bright Side MANA BOOMMANA On A Tear you in bro. This One who knows how high it will go could go 25 or just 5. Nice looking trend line lots more room to run.

MANA | SHORTCOINBASE:MANAUSD
It look bearish to me, HS pattern.
TP1: 4
TP2: 3.6
*This is my idea and could be wrong 100%

Mana trying to flip the inv h&s neckline to supportIf it can succeed in flipping the neckline of this inverse head and shoulder pattern to solidified support, then the breakout target of the pattern should be around 1.28-1.30. It hasn’t validated its breakout yet though so if bitcoin takes a tumble, it could take mana down with it before it gets a chance to validate this pattern. Will likely see it decide which way it will go in the next 2-4 days. *not financial advice*


MANAUSD Bull ExperimentMANA is starting to look primed for some upside momentum, more so than most of its peers anyway. Buy low, sell high. Let's see what happens.

⚡️⚡️ #MANA/USDT - 900%⚡️⚡️⚡️⚡️ #MANA/USDT - 900%⚡️⚡️
#HODL
Entry Conditions:
- RSI Daily Trendline Breakout
- Dubai’s Metaverse Plan Targets 40,000 Virtual Jobs in Five Years
We launched the Dubai Metaverse Strategy today, which aims to foster innovation in new technology. Dubai is home to over 1,000 companies operating in the metaverse and blockchain sector, which contributes $500 million to our national economy.
News Source:
finbold.com
Entry Zone:
1) 0.5985 - 0.9610
Take-Profit Targets:
1) 1.349 - 12.5%
2) 1.705 - 12.5%
3) 2.184 - 12.5%
4) 2.792 - 12.5%
5) 3.504 - 12.5%
6) 5.101 - 12.5%
7) 6.068 - 12.5%
8) Leave open to ride as could be parabolic at this stage
Stop Targets:
1) 0.2819 - 100.0%
Entry Conditions:
- RSI Daily Trendline Breakout
- Dubai’s Metaverse Plan Targets 40,000 Virtual Jobs in Five Years
We launched the Dubai Metaverse Strategy today, which aims to foster innovation in new technology. Dubai is home to over 1,000 companies operating in the metaverse and blockchain sector, which contributes $500 million to our national economy.

#MANA #breakout - up to the meta verse :)$MANAUSD Breakout in 1h Chart
1. Positive Super Trend in 4h Chart & Consolidation > 60 (1h) bars
2. Several touching points with vwap
3. Price above 10, 20 & 50 EMA
4. Target 1.1160$
5. Stop-Loss 0.94$
6. Risk Reward Ratio 4.0

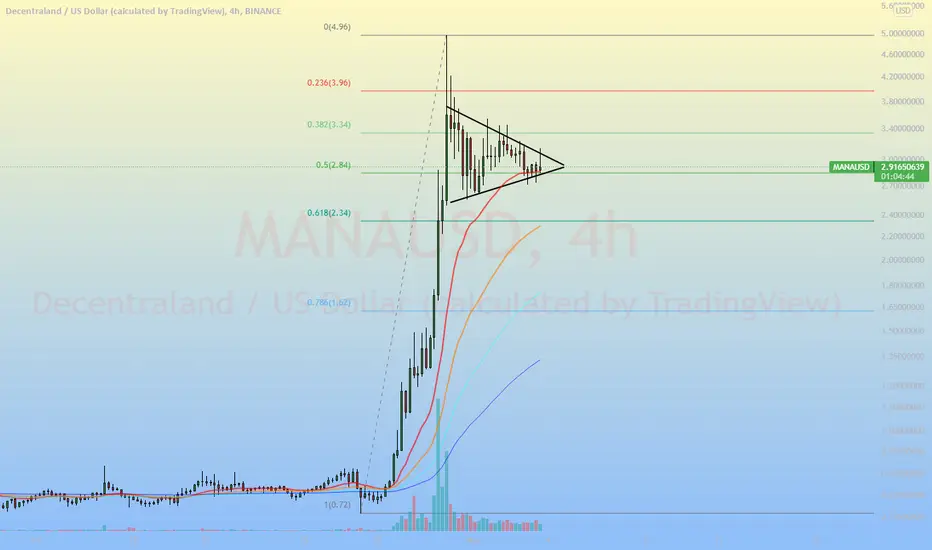
Bullish Pennant FormingNice run up on MANA.
Feeding off Facebook metaverse hype.
Looks like a bullish continuation pattern forming on the 4h.
As always, trade the breakout
MANA/USDTesting/tracking elliot wave theory. Please do not trade off idea without S/L. Not financial advice.
RR: 19.7
Possible upside: 1200%
Possible downside: 61%
Timeframe is on the weekly.
Elliot wave cannot predict time so do not try to use the timeline shown here for your trades.
What Elliot wave can do is help predict tops and bottoms (no one can predict these 2 accurately)
With the predictions it's supposed to help you use it as a method to plan your entry/exit your positions.

MANAUSD (4H) Bullish reversalHi Traders
MANAUSD (4H Timeframe)
Waiting for the upward break of 0.9040 resistance level, which will complete a bullish trend reversal pattern to go LONG. Only the downward break of 0.8090 would cancel the bullish scenario.
Trade details
Entry: 0.9040
Stop loss: 0.8090
Take profit 1: 0.9620
Take profit 2: 1.0570
Score: 4
Strategy: Bullish reversal
