MANA - Potential SHORTS -1hrly/4hrly - Bybit: MANAUSDTPERP Trading view post:
Trade Status: ACTIVE
Trader: Drizzzled (AUS)
Trade Type: SHORTS
(RE-ENTRY/DCA/LADDER previous entry post
Entry 1: 0.7968 (or any of entry 1 zone options)
-if missed focus on next entries. Don’t stress.
Entry 2: 0.8551 “”
Entry 3: 0.9361 “”
Entry 4: “”
Entry 5: “”
Entry 6:
Entry 7:
Stop Loss/ladder re-entries:
Entry 1: 0.8235 or slight light above (resistance)
-slightly below your re-entries
-5-10% move from your chosen entry 1
-slightly above/below entry/key resistance
-1:1 or to own personal risk factor
Entry 2: 0.8759 “”
Entry 3: 0.9542 “”
Take Profit Targets:
- 0.7769
- 0.7552
- 0.7297
- 0.6939
Comments:
-move stop loss to break even once target 1 is hit. DCA entries above/below if stop loss is hit.
-emas will rise/drop with time so shift tp accordingly. If we re-enter higher/lower our same emas become our take profits. Also i have put boxes around key supports which I may choose to take earlier or later profits at too.
-by all means you can long from the daily open to these higher target ‘short’ entries.
-you don’t have to enter at ‘entry 1’ if you would rather enter higher.
-level 1,2 or 3 ,pumps/moves, can go higher and create new levels, hence the re-entries. It’s a shorter time frame strategy.
-the harmonic targets are the take profits of the opposite trade to ours so it’s our res/support to enter at.
-don’t hesitate to dm me for guidance :)
MANAUSDT.3L trade ideas

Mana longPennant chart pattern is our friend here, a breakout to the upside on H4. Price closes above, confirms buy bias. Wait for minor draw down to buy cheaper or take a buy position now on spot.

MANA 15min TFBullflag price target on 15min TF .87cents the other ideas tagged still stand in my opinion but this is a target for the short term

Mana off the orderblock retestWe are retesting .76cent and the it looks like the area of confluence is .98cents


ManaUsdt Looks Bulish Forming bulish Penant In h4 timeframe
Incase Of breakout expecting 45 to 50% bulish Move Keep Eyes On Mana for breakout

MANA bullish pattern 😎🔥😎🔥😎Hi dear traders
MANA forming bullish pattern.
If hold above EMA50, the price rise to specified targets.
Let's see what happens.
This is not financial advice ( DYOR )
Good luck

Another 10% gain just buy trading the prior high breakoutWhy tradingview default scanner cant have this alerts i dont know, but now i coded my own prior days high breaking scanner
Will keep you updated tomorrow when new signals come in…

🔥 MANA Bullish ChannelOver the last several days, MANA has formed a bullish channel. I'm looking at the top of the channel as the first target.
Since the market is still dominantly bullish in the short-term, I'm also anticipating a break out through the resistance at some point in the near future. In the case of a break out I have $0.90 as my target.

manauusdt looking to o long manua has been respectinh s tructure . given thre trend im most likely looking to buy at previous order blocks\ict propulsion block with tight stops

MANA trade First time sharing the analysis
I saw it is passing the EMA 50, and trend line. It already tested so many times on EMA 50 respectfully.

#Mana Be ready for a 30% profitThe analysis is based on Smart Money and you can see the entry point as well as the targets on Fibo.

MANA/USDT. BitVero Crypto Academy.
Disclamer:
We are not financial advisors. The content that we share on this website are for educational purposes and are our own personal opinions.

MANA: Pullback in UptrendDecentraland (MANA) technical analysis:
Trade setup : Price broke back above $0.42 and $0.60 key levels, and above 200-day moving average, with robust volumes, which are indications of bullish trend reversal. Pullback near $0.60 support could be a swing entry in Uptrend.
Trend : Uptrend on Short- and Medium-Term basis and Downtrend on Long-Term basis.
Momentum is Bullish but inflecting. MACD Line is above MACD Signal Line and RSI is above 55 but momentum may have peaked since MACD Histogram bars are declining, which suggests that momentum is weakening.
Support and Resistance : Nearest Support Zone is $0.60 (previous resistance), then $0.42. The nearest Resistance Zone is $0.75, then $1.00.

MANA/USDT - (looking bearish)mana/usd looking not good for long its look like bearish movement coming in mana coin. i am gooing to short mana at my marked entry zone.
1.5% risk & 12% target

Static support area of $0.55MANA recorded good price growth during the last weeks. In the previous analysis, this price increase was predicted according to the candles' reversal signs and the RSI indicator. But because the market entered an upward phase, the ceiling of the main descending channel of MANA was also broken, and the price is above the level of $0.58 -$0.66. We can say that the daily time trend of MANA is up. Therefore, pullbacks can create a strong positive reaction to support levels. The price of MANA has entered an ascending channel in the 4-hour time frame. As long as the bottom of the channel is maintained and the static support area of $0.55, we can expect further price growth. So, at this level of support, we can again expect a positive reaction and an increase in demand. Also, if the short-term ascending channel is maintained, MANA can grow to $1.12.

MANA is at the peak and now for some shallow restingBased on current impressive impulse up from the dead, Mana has reached its peak, and now it is time for some rest,
Due to strong impulse up, a shallow retracement is unavoidable, and for those who yet to jump in the train, wait for some shallow retracement before entering the trade.
This is based on hourly chart, so shouldnt be that long to wait for the correction to end.
Have fun trading!

MANAUSDT SWING LONG Here are the fews points i am looking for this chart
1.Price showing us deep pull back breaking though last uptrend swing low
2.Price showing us a new strong momentum to the upside
3.We can compare those down wave to the new up wave , very clear that buyer are taking control
4.Price start to consolidate and holding up the FIB 50% level (showing us price are strong to buy )
5.We need to see price break out in strong momentum bar before we entry (maybe restested )
6.Remember we are buying new higher high make sure moved you stop loss to breakeven when you are in profit about 1-1 risk and reward
7. Target : no Target (trend following )

MANAUSDT breakout triangle pattern Failure and departure from MANAUSDT breakout triangle pattern
BUY SIGNAL
Failure and departure from compression range

MANA: Approaching ResistanceDecentraland (MANA) technical analysis:
Trade setup : Price broke back above $0.42 and $0.60 key levels, and above 200-day moving average, with robust volumes. Trends have reveresed to an Uptrend. Now approaching $0.75 resistance and is overbought (RSI > 75), likely to pull back some, before resuming uptrend.
Trend : Uptrend on Short- and Medium-Term basis and Downtrend on Long-Term basis.
Momentum is Bullish but extremely overbought. (MACD Line is above MACD Signal Line). RSI is bullish (> 55) but extremely overbought (> 80) which could imply that price could briefly pause or pull back if it reaches Resistance.
Support and Resistance : Nearest Support Zone is $0.60 (previous resistance), then $0.42. The nearest Resistance Zone is $0.75, then $1.00.

Manausdtperp potential tradeAs daily price action is now facing a strong Supply area we may potentially face the pullback ,
or a continuation of a bear trend.
Currently At Supply Area Bearish divergence show and then now we have a Failed reaction on the 4 hour timeframe ,
breaking the nearest demand area and price can potentially tap to supply area then drop.
This is not financial advice , i just share on what i think on the market.
Do your on research , Learn to Read the market . and also dont rely to anyone!

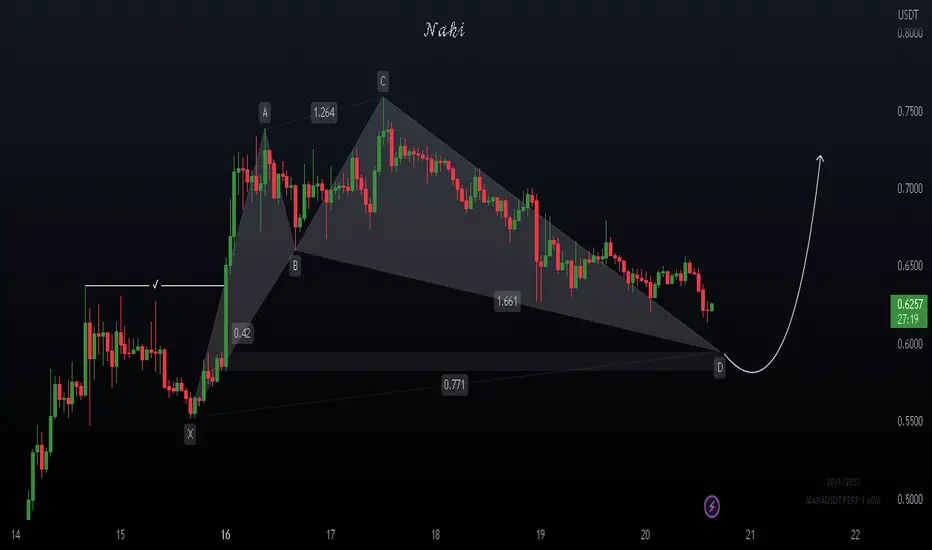
MANA still has some juice left!after retest of the broken resistance at $0.625 area we can see another impulse up.
let me know what you think.
