MANA WITH 24% GAIN SINCE LAST ANALYSIS
price reacting nicely to analysis and we have seen over 24% gain. This spot is good for taking some profit should incase price retraces back to origin. I will keep updating chart stay tuned.
MANAUSDT trade ideas

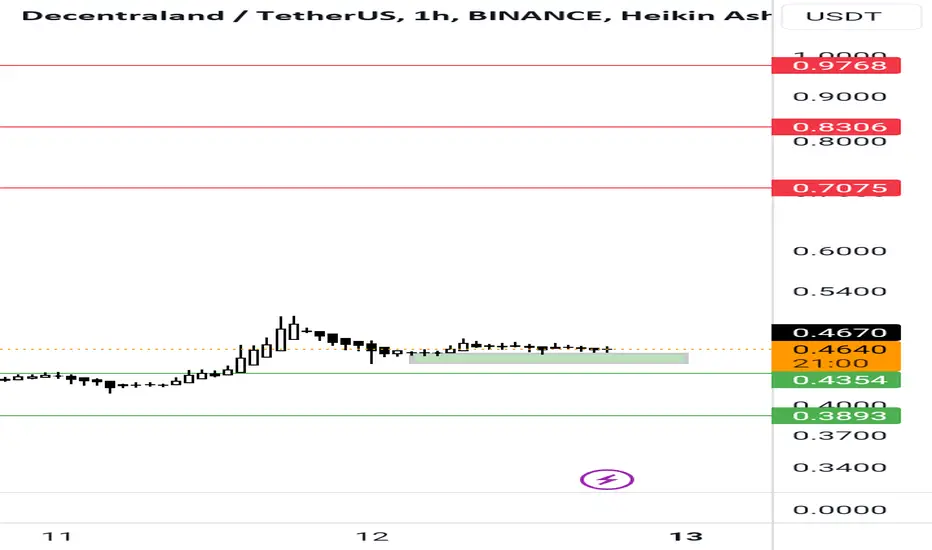
MANAThe first targets that can be considered, if the green lines are not broken, are the red numbers

MANAUSDT Trend Line Breakout!MANAUSDT Technical analysis ypdate
MANA's price is approaching the trend resistance line, and volume has been gradually increasing over the past month. If the price breaks out above this resistance level, we can expect a significant upward move.
Regards
Hexa

MANA IS STRONGIn the weekly time
The chart is very beautiful
Rsi is more beautiful
0.70 coming soon
Just need to break out

MANA Suggests SAND will Push HigherComparing these charts suggests SAND will go higher to follow MANA. They both are following the exact price action, and MANA is currently retesting 200ema, whereas SAND is lagging behind.

take off?
RSI:
If the resistance of 62.78 is broken, it could be a sign of strong buying pressure in the market.
Analysts:
The downward trend line has been broken and has reached an important resistance level. If the 0.4868 level is broken, we can expect a 56% move up.
Volume:
In the past 43 days, buying pressure has been strong and the price has met resistance with good volume. There is a possibility that the price will test this range again before moving higher.


MANA/USDTEURONEXT:MANA really nice setup here for a breakout trade set alert on resistance, I have measured target of the falling wedge pattern!


Price shoul go further bullish till 0.4860 Price has broken a bullish falling wedge pattern in the H4 time frame and according to this pattern target market should go further bullish till 0.4860

MANA/USDT Anticipating Bullish Momentum?👀🚀MANA Today Analysis💎 Paradisers, direct your attention to MANAUSDT as it exhibits a notable pattern, suggesting a strong probability for a bullish move.
💎#MANA historical performance reveals a tendency to adhere to a descending channel pattern, with a break above leading to an upward trajectory. Presently, it is demonstrating a bullish stance. The critical level to watch is $.4244; maintaining momentum at or above this level could indicate a bullish continuation.
💎Should it fail to hold, the next focal zone is at $.3931, aligning with the observed pattern trajectory. #MANA sustained upward momentum is targeting a resistance level at $.4968, with the potential to rise further towards supply levels at $0.6932.
💎 Furthermore, prepare for a potential bullish resurgence from the support level of $.3581 if #MANA does not sustain its upward momentum. A drop below this level could raise concerns about the viability of the ongoing bullish trend.
💎 In the current dynamic and fluid market environment, strategic planning and discerning decision-making are critical. Developing a comprehensive trading strategy, incorporating effective money management, and a deep understanding of support and resistance levels, is essential for achieving sustained trading success. 🌴💰

It may also be the beginning of formationThe mana can also work in a bowl or cup handle formation.If the bowl formation works, the target is 1.40
a medium term formation
If BTC does not break the rules of the game, this formation is valid.

manaBy keeping the green box, the above numbers are activated
If the green lines are broken, then it should be checked

MANA EYEING $0.7
MANAUST to possibly reach $0.7 after this consolidation, ideal area to bag EURONEXT:MANA is at the lower region of the consolidation box or slightly below it. There is context to this on the daily timeframe but one step at a time. I will keep updating stay tuned and turn on notification.

🚀 Decentraland (MANA) Analysis: Breakout and Retest in Focus! In early November, Decentraland (MANA) made a significant move by breaking out of its descending resistance line, a trend that persisted since May 2022, starting at $0.38. A notable achievement signaling a potential shift in market dynamics.
However, in a retracement move, MANA revisited and retested this breakout point just yesterday. The current state of being oversold indicates a potential consolidation phase, where the price may stabilize before attempting further moves.
Key points to watch:
Oversold Conditions: With the price currently in oversold territory, a period of consolidation is expected.
Future Targets: Anticipating consolidation, the next potential targets to watch are in the range of $0.50 - $0.58. This range becomes critical for assessing the sustainability of the breakout and potential future upward movements.

MANA 1DHello friends, for mana, our optimal entry zone is at the Philip level, which is between 0.3398-0.3235.
The cancellation of this scenario is closing the final price above the previous ceiling.
Time frame: 1D

MANAUSDT - Might PUMP today!MANA - I love this token I got it on the last Bull Run and topped up at $0.25 at the bottom again.
I feel the #metaverse will play a big part in the everyday life of humans soon!
Think it might rip a little today as well check my chart for more information!

Decentraland (MANA) setup for upto 18.50% pumpHi dear friends hope you are well and welcome to the new trade setup of Decentraland (MANA) with US Dollar pair
Previously we caught almost 17% pump of MANA as below:
Now on a 4-hr time frame, MANA has completed a bullish Gartley setup for the next price reversal.
Note: Above idea is for educational purpose only. It is advised to diversify and strictly follow the stop loss, and don't get stuck with trade.

ManaAfter finding the most important area, the next step is to observe the behavior of the price with this area

ManaIn the down time, the green box is considered as support, and in case of failure, the green line is the best target and the resistance is the red line.
✴️ Decentraland Double Bottom & 530% Growth PotentialHello my dear supporter, let's keep this one short and simple while we consider a 500% potential profits for the upcoming Decentraland bullish wave; This is a high probability trade setup.
Let's start with the weekly RSI, MANAUSDT:
Yes, we have a bullish divergence on the RSI, a broken descending channel and a new high... But compared this to MANAUSDT.
Notice how the January peak price for MANAUSDT is much higher than the current price, ~80% higher to be more exact, while the RSI on the other hand trades much higher compared to January 2023... This is a signal of strength.
Couple this with four sessions closing green, the last one closing today, and we have a very strong bullish setup.
Short & simple; Easy & sweet; This explanation is all we need!
These signals are revealing to us that something good is about to happen to this Cryptocurrency trading pair.
Thank you for reading.
Thanks a lot for your continued support.
Namaste.

MANAUSDT.P TODAYPLZ DO NOT SELL MY SIGNALS
1-Apply your own risk management.
2-Daily and Weekly Targets
3-Hunt the profits at any level you see convenient for you.
have a good day guys.
