MANA relong PA looking more bullish and consolidating at support. If truly bullish it should resolve higher in the next few hours. Will cut it, if it stagnates or starts to breakdown. half risk
MANAUSDT trade ideas

MANA - prev week range high breakout.consolidation above range + back into monthly range
invalidation close back into weekly range and outside monthly, where i take bearish trade back to mid weekly range

MANAUSDT Elliott Waves AnalysisHello friends.
Please support my work by clicking the LIKE button👍(If you liked). Also i will appreciate for ur activity. Thank you!
Everything on the chart.
Entry: market and lower
Targets: 0.7 - 0.9 - ~1.05
after first target reached move ur stop to breakeven
Stop: (depending of ur risk). ALWAYS follow ur RM .
risk is justified
Good luck everyone!
Follow me on TRADINGView, if you don't want to miss my next analysis or signals.
It's not financial advice.
Dont Forget, always make your own research before to trade my ideas!
Open to any questions and suggestions.

MANAUSDT ANALYSIS In this analysis, you will find more about the potential set-ups depending on how this current daily candle will close.

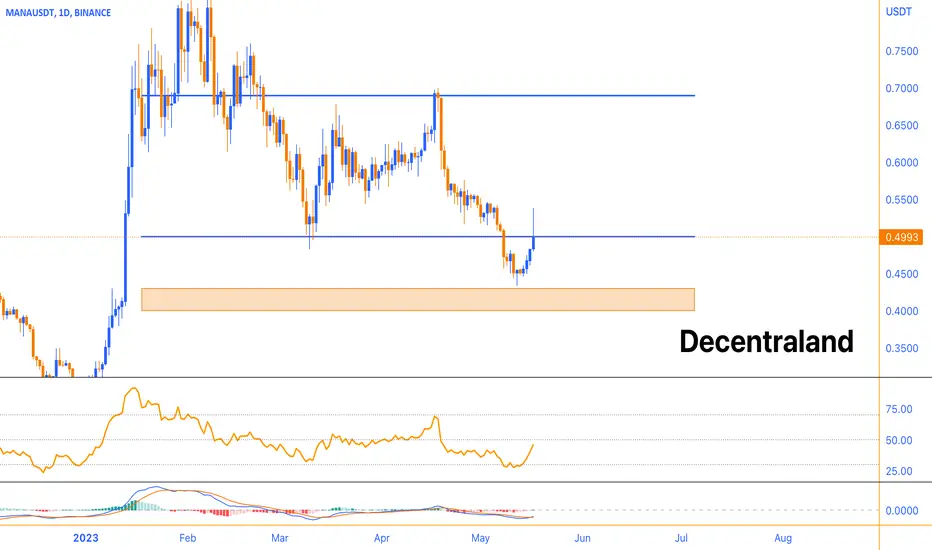
Price Analysis and Market Outlook for MANAMANA has exhibited a consistent downward trend over the past month. Following a negative response to the resistance level at $0.69, the currency's price breached the upward trend line and retraced back to established support levels. A range of support has been identified around the price point of $0.44, which aligns closely with the 0.618 Fibonacci retracement level. However, considering the previous analysis which identified support within the $0.40-$0.43 range, there remains a possibility that the price may reach this level and elicit a stronger reaction than the current one.
Nevertheless, should the price rebound from this range, there are indications suggesting the correction may be nearing its conclusion, especially if a significant breakthrough of the $0.50 resistance level occurs. Additionally, considering the timeframe, the price is currently within the expected range for the completion of the correction wave. Consequently, if a robust recovery materializes above the aforementioned threshold, it is likely that the price will experience growth in the ensuing days.
Decentraland MANA price can be one of 1st to start a rising waveToday we will talk about the prospects for the price of the Decentraland token - MANA
But first, please like our previous idea MANAUSDT, which has perfectly worked out the sales area and recently the purchase area for 4 months.
It looks like the MANAUSD price has completed its correctional wave (2) and is now trying to start a growth wave (3).
Wave (3) is considered to be the longest, and given that there are many liquidity zones above, the path of growth will not be easy.
However, we have schematically depicted on the chart how the growth and correction waves can look like.
The intermediate targets for MANA's price growth are $0.90 and $1.85.
The final selling zone for MANAUSDT, which is now visible in the probable wave (3), may be in the area of $2.25-2.50.
What do you think, will such a positive scenario work out given the current pessimistic sentiment in the cryptocurrency market?)
_____________________
Did you like our analysis? Leave a comment, like, and follow to get more

Mana Looking Good for Midterm Looks Like Mana Is ready For recovery in coming weeks Formed Descending Channel in 3days Tf Expecting Massive Breakout Soon Incase Of Successful Breakout Expecting 280 to 300% Bullish wave

mana getting ready to retrace back to the downsideI just opened a short on Mana, expect a retrace back to 0.4931.....stay tuned

MANA Big move coming! (Long entry setup)Mana has strongly changed character from a key point, I expect a minor pullback validating the change of character and a move up from here!
NFA


🚀 MANA TRIANGLE BREAKOUT INCOMING? KEY LEVEL AT $0.48! 📈 🔥Hi, friends! Mana is consolidating inside a huge triangle since mid-January. I think it's time for this altcoin to show all its strength.
The most important key level is at $0.48. The false breakout of it will be a huge trigger for MANA growth.
📊 TRADING PLAN FOR MANA:
1. false breakout of the key level $0.48
2. volume growth
3. bullish BTC is a must-have for altcoins growth
✅ MY TARGETS FOR MANA:
🔥 $0.58-0.62 - the value area
🔥 $0.7 - the key level
🔥 $0.85 - the local high
💻Friends, press the "boost"🚀 button, write comments, and share with your friends - it will be the best THANK YOU.
P.S. Personally, I open an entry if the price shows it according to my strategy.
Always do your analysis before making a trade.

#MANAUSDT #LQR #TOBTC #LaqiraProtocol
● You could get a maximum of 70% ✌️😉 profit from the April 5 analysis
• Support and resistance are specified in the chart
• Levels are obtained from the intersection of the fib and static levels
• You can open a position after confirmation
• This analysis is not an offer to buy or sell

manausdtThe entry range of 0.4111, which is several size moves, as well as the 66% pullback if the selling pressure is high, the second range for buying is 0.3578 and the first target of the ceiling of the previous up move.

LONG MANA , LIMIT ORDERThis is a very important OB
and the previous OB is practically mitigated, so I don't think it can withstand one more downward impulse.
Entering at the level of this OB would be excellent news.

MANA/USDT looking for a breakdown hereHey guys 👋
Let's kick off this day with MANA coin where we see a nice potential for a breakdown to happen. Waiting and looking closely here
If you like ideas provided by our team you can show us your support by liking and commenting.
Yours Sincerely,
Swallow Team 🔱
Disclamer:
We are not financial advisors. The content that we share on this website are for educational purposes and are our own personal opinions.

MANA CUP AND HANDEL INVERSE 🤔☕🤔🖐🤔Hi dear traders
MANA has formed inverse Cup & Handel.
If neckline breakout correctly we can open short position and take some profit 📈.
Wait for breakout
All targets specified.
Let's see what happens
This is not financial advice ( DYOR )
Good luck

MANA SHORTOrder Block Bearish has not been mitigated trend right now is bearish and may go for order block bullish below, if not mitigated we may see a bounce to order block in which we open short


MANA short set-upCurrently at support expecting some further retrace before further down.
Yearly open is approx. 50% short away.
when MANA moves it moves very vertical (both up and downwards).

✴️ Decentraland Hits Bottom? -95% From All-Time HighIt is possible that MANAUSDT (Decentraland) hit bottom after dropping 95% in value from its All-Time High.
The weekly RSI is at its lowest level ever and continues moving lower.
The current price hit its lowest level since February 2021.
Altcoins tend to correct between and 90-98% in bear markets so this one is very likely done.
We are seeing altcoin after altcoin hit bottom...
Once we hit bottom, the only place left to go is up.
Get ready.
Prepare... The next altcoins bull market is going to last a long while and it will be the strongest we've seen so far.
Namaste.

Hello you can buy mana now long manausdt now..
low stop lose and big target....
all targets are in chart
stop limit 0.5530
take care about the updates in this idea we will put our stop lose at break even fast because the market its not that good....
Goodluck

#LQR #TOBTC #MANAImportant Reisstance are Aimed for MANA
you need to take you'r own Trigger on the Red area

Mana can price to a 1$ target. 75% GainThe mana rally could start again, we saw a price going from 0.30 cents to 0.84 cents at the beginning of January. After the process, with the BTC.dom increase, the price retreated and made its correction.
From my observations, MANA whales seem to be insatiable and demanding lately. There may be a 75 percent price increase in the coming days, and it may go up to $1. Let's see the process.
TP: 1$
