MANA: Approaching ResistanceDecentraland (MANA) technical analysis:
Trade setup : Price broke back above $0.42 and $0.60 key levels, and above 200-day moving average, with robust volumes. Trends have reveresed to an Uptrend. Now approaching $0.75 resistance and is overbought (RSI > 75), likely to pull back some, before resuming uptrend.
Trend : Uptrend on Short- and Medium-Term basis and Downtrend on Long-Term basis.
Momentum is Bullish but extremely overbought. (MACD Line is above MACD Signal Line). RSI is bullish (> 55) but extremely overbought (> 80) which could imply that price could briefly pause or pull back if it reaches Resistance.
Support and Resistance : Nearest Support Zone is $0.60 (previous resistance), then $0.42. The nearest Resistance Zone is $0.75, then $1.00.
MANAUSDT trade ideas

Manausdtperp potential tradeAs daily price action is now facing a strong Supply area we may potentially face the pullback ,
or a continuation of a bear trend.
Currently At Supply Area Bearish divergence show and then now we have a Failed reaction on the 4 hour timeframe ,
breaking the nearest demand area and price can potentially tap to supply area then drop.
This is not financial advice , i just share on what i think on the market.
Do your on research , Learn to Read the market . and also dont rely to anyone!

MANA still has some juice left!after retest of the broken resistance at $0.625 area we can see another impulse up.
let me know what you think.

MANA - Perfect spot for short in my opinion!Hi guys, hope you are doing fine. I was laying on the bed, and I just noticed another pump from Mana to the TOP of the chanell. I decided to open short because for me looks very good. Please always be careful when you are trying to copy my moves. In a lot of situations Im making corrections and adjust my entry positions for perfect profits. I do not make updates because sometimes it is just happening too fast. Good luck!

MANAUSD ❕ resistance areaMANA is under liquidity.
The RSI chart indicates overbought (4H TF)
Price and trading volumes indicate bearish divergence (4H and 1H TFs)
The asset will start to decline after it fixes under the resistance area.

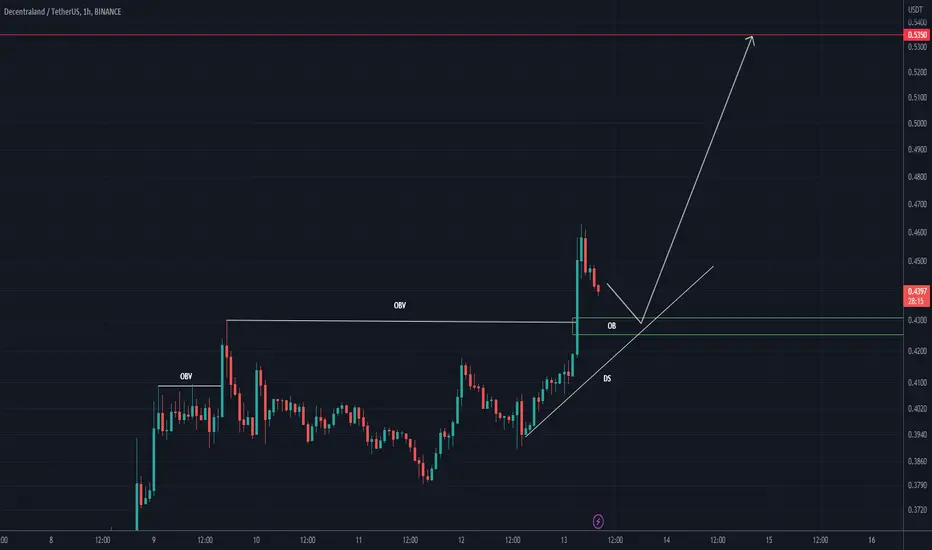
MANA/USDT. #MANA LONG SETUP 🟢
IT WILL SHOOT TOWARD TARGET AFTER BREAKOUT 🚀
USE LOW LEVERAGE - HIGH RISK 👍
BitVero Crypto Academy.
Disclamer:
We are not financial advisors. The content that we share on this website are for educational purposes and are our own personal opinions.
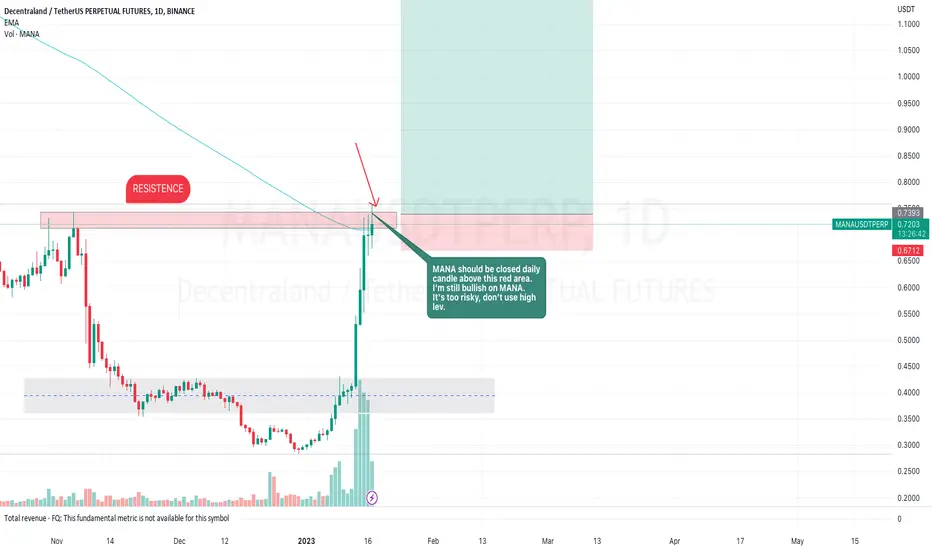
MANA/USDT. I'm still bullish on MANA if it gonna be breakout red are and channel successfully.
BitVero Crypto Academy.
Disclamer:
We are not financial advisors. The content that we share on this website are for educational purposes and are our own personal opinions.

Decentraland MANA showed good growth, but may be a correctionFor more than a year, the value of game tokens has shown perhaps the most painful fall.
But with the chiming of the chimes on New Year's Eve, MANA buyers started aggressive purchases, which caused a huge price increase.
At the time of writing, the value of MANAUSDT has increased by +166% in 17 days.
In parallel, the value of other popular tokens from the gaming industry is also growing aggressively: GALA, SAND, even AXS and SLP (the value of which began to fall even before it became "mainstream" in the crypto market) For most of these coins, we made ideas, if you are interested, then search in our profile.
Now the MANAUSD price has entered a strong liquidity zone of $0.70-0.80, which, in our opinion, will not be possible to break up the first time.
Therefore, it is worth taking into account the possibility of fixing profits at least on part of long positions, because a rather strong correction to the region of $0.42-0.48 may occur ahead.
If the possible price movement is sorted out, then the next question remains a mystery: "What could have revived interest in game tokens so much?"
Please write your answers in the comments below the idea
_____________________
Did you like our analysis? Leave a comment, like, and follow to get more

MANA BEARISH MANA is at daily time frame resistance, and lower time frames are producing bearish divergence
I entered short trade at 0.74
DYOR

Will Mana fly from 0,7 to 5 usdt like on Sept 21st 2021? Almost 2 years ago, Mana fly to 5 usdt from 0,7. Today for awhile, Mana has moved around this point, following the movement of BTC and ETH. Based on the line that I drew, we can go back to 2021 and see that this is a vital price for Mana. We will see!!

Lets Fly with ManaHello Traders!
Welcome, back to another trade with Analyst Aadil1000x.
Today we are Setting a buy limit in Manausdt and will try to catch this pump. The Limit is at the key reversal Area.
Mana Buy Limit 0.7168
Stoploss 0.6995(-2.02%)
Target 1, 0.7485(+4.42%)
Final Target 0.7858(+9.63%)
Don't forget to hit the like button and follow to stay connected.

MANA: CYCLE COIN ON RISE $1.70 TARGET ITS BACKMANA is one of the cycle coins that have a high chance of breakout in the coming time.
We have a list of study cycle coins and Mana is one of the coins.
We expect that this coin going to break out the coming time, and we expect that this coin is able to target $1.70 "
One year ago this coin did $5.90 and depending on our study it's able to do $1.70
The point between $0,74 and $0,80 is a breakout point
We have a list of 13 cycle coins from all trending coins, and Mana is one of them that goes into a high breakout coming time.

MANA IS NO 2 FROM A LIST OF 13 CYCLE COINSWe did study the trend and made depending on the cycle calculate the total of the 13 cycle coins.
We did a choice of coins that have a high possibility to increase in the coming time.
To make a choice like this we did a study from TA until the transaction data of a coin to get the right image of the trend.
Mana seems very interesting for the trend, and depending on our study is that Mana has a high chance of breakout out.
The breakout point
between $0,74 and $0,80, Mana makes a high chance of breakout with a trend above 1 USD.
WE know that most of times cycle coins going into unexpected breakouts.
Our target for Mana for the coming time is $1.70
Mana has shown interesting patterns, and same time also a whale follows DCA, which makes this coin very interesting for this cycle.
In our service district , we did add the rest of the 12 coins see below the update.
Share your idea about what you think about Mana.
Let's see if this target of $1.70 can become real price action coming time.
🌠And at the same time if this coin can show the effect of a real cycle coin.🌠

It can be supported againMANA has registered more than 17% price growth in the last 24 hours. Resistance in the range of $0.56 to $0.65 was considered for MANA, which was broken by strong candles. If the high price of this area stabilizes, it can be supported again. In this case, the next targets of the buyers will be in the range of 1 to 1.10 dollars. Another point is that the break of the ceiling of the main descending channel was without a pullback, which is a sign of the strong strength of the buyers and the reversal of the trend in the daily timeframe. So if we have a correction, the second support is considered in the $0.50 range.

MANA Long SetupHi, dear traders. how are you ? Today we have a viewpoint to BUY/LONG the MANA symbol.
For risk management, please don't forget stop loss and capital management
When we reach the first target, save some profit and then change the stop to entry
Comment if you have any questions
Thank You

MANA - Impulsive Wave FinishedDecentraland´s MANA Token had a blast to the upside this year, gaining over 150%. But is it time to buy?
We have a valid wave count to consider that the impulsive wave is over. We also have RSI divergence, as indicated by the green line.
On the daily timeframe, RSI hit above 90 (extremely overbought), and price is being rejected at the junction of an important resistance level and a falling trendline.
As traders, we have to avoid FOMO and wait for the right conditions to enter a trade, and MANA is definitely not in that spot.
I´ll be waiting for a correction, first targeting 0.60 support, and possibly 0.50 (50% pullback).

MANA Long Setuphi, dear traders. how are you ? Today we have a viewpoint to BUY/LONG the MANA symbol.
For risk management, please don't forget stop loss and capital management
When we reach the first target, save some profit and then change the stop to entry
Comment if you have any questions
Thank You
Manausdt Recently I shared analysis And Sofar 150%+ Up Now Breakout confirmed In daily trendline Expecting Another Massive bounce
Expecting 150_200% Bounce

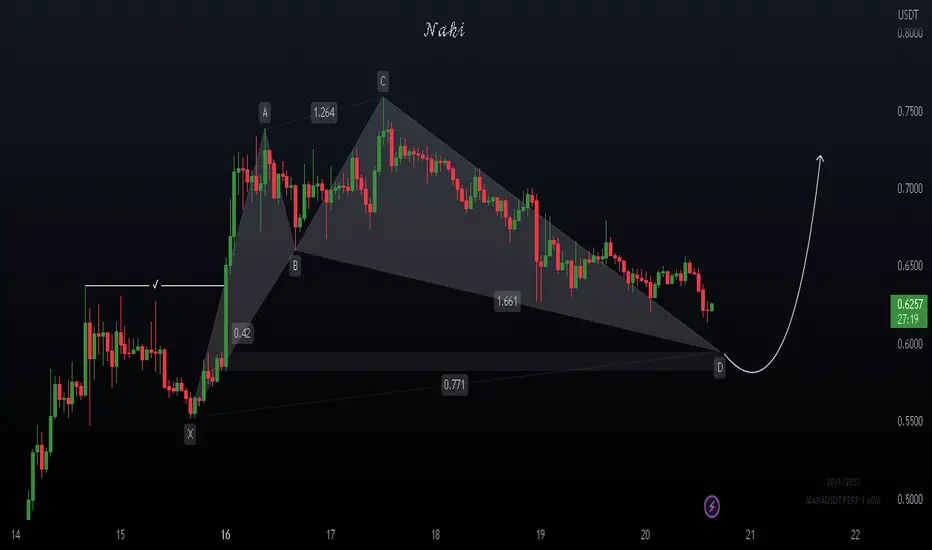
Mana Bullish DiametricWe will see if this happens, should launch very soon if this is correct... invalidated if it really goes any lower than here and if it takes much more time.
Not advice.

To unleash the rising power...Hello?
Traders, welcome.
If you "Follow", you can always get new information quickly.
Please also click "Boost".
Have a nice day.
-------------------------------------
(MANABTC 1W chart)
In order to release the power of a full-fledged rise, it is necessary to check whether it can rise above 0.0000 3732.
-------------------------------------------
(MANAUSDT 1W chart)
In order to continue the mid- to long-term upward trend, the key is whether it can rise to the 0.7051-1.0952 range.
(1D chart)
If possible, the question is whether support above 0.6537 can lead to an upward move above 0.7051.
If not, it falls
1st: around 0.58
2nd order: around 0.4970
You need to check if it is supported in the 1st and 2nd sections.
If it falls below the 2nd section, there is a possibility that it will turn into a downtrend.
when it rises,
1st: around 0.8387
2nd order: around 1.0952
It is necessary to check whether the 1st and 2nd sections are touched.
-------------------------------------------------- -------------------------------------------
** All descriptions are for reference only and do not guarantee profit or loss in investment.
** If this chart is shared, you can use the indicators normally.
** The MRHAB-T indicator includes indicators that indicate points of support and resistance.
** HA SRRC indicators are displayed as StochRSI (line), RSI (columns), and CCI (bgcolor).
** The CCI indicator is displayed in the overbought section (CCI > +100) and oversold section (CCI < -100).
(Short-term Stop Loss can be said to be a point where profit or loss can be preserved or additional entry can be made by split trading. This is a short-term investment perspective.)
---------------------------------

Why I am shorting MANA hereHey guys,
There are several reason why I am shorting MANA here. First because of the price action, this is a supply zone and I see the reaction of the price to this level. Despite the fact the bullish trend is strong, the sellers usually get into the market and take profit. Even if the Bullish trend suppose to continue, we need some correction and I am going to bet against the trend for a down momentum.
Also if you se Fib, either retrace or extension, both point the area as strong resistance area.
Add on to this, I am using an indicator based on RSI and CCI, which I published it and you can use it too, and it is pointing this area is selling zone. Here is the link
All in all, I have opened a short position with this SL and TP.
=====
nothing in this post is financial advice.

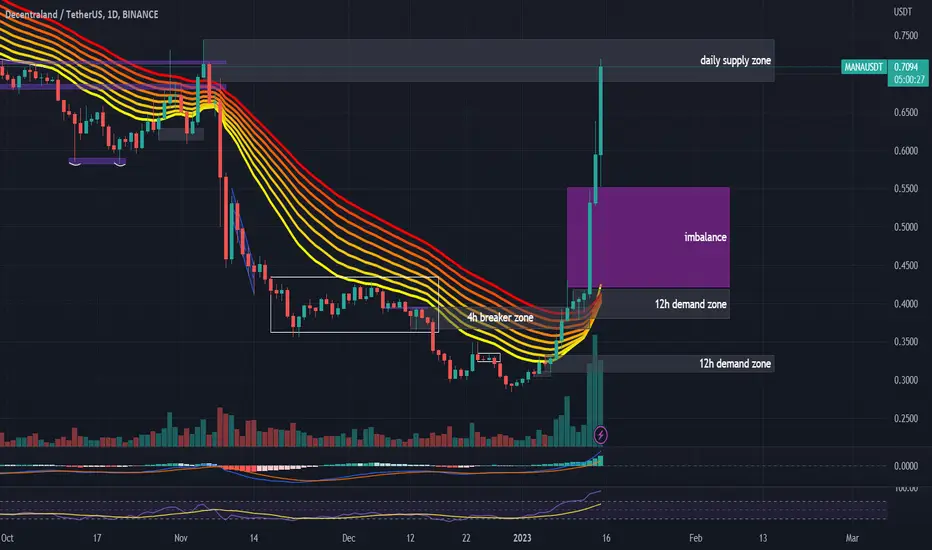
#MANAUSDT Daily Chart
Price moved up aggressively and reached the daily supply around $0.708. MACD is bullish, RSI is overbought and EMAs are neutral. We shall wait for confirmation but overall price should move down from here aiming to fill the imbalance around $0.5. We have a very strong bullish momentum at the moment so shorting directly is very risky.