MANAUSDTThe price adjustment of the higher price cycle is being completed. The Fibo range of the specified price is attractive.
MANAUSDT trade ideas

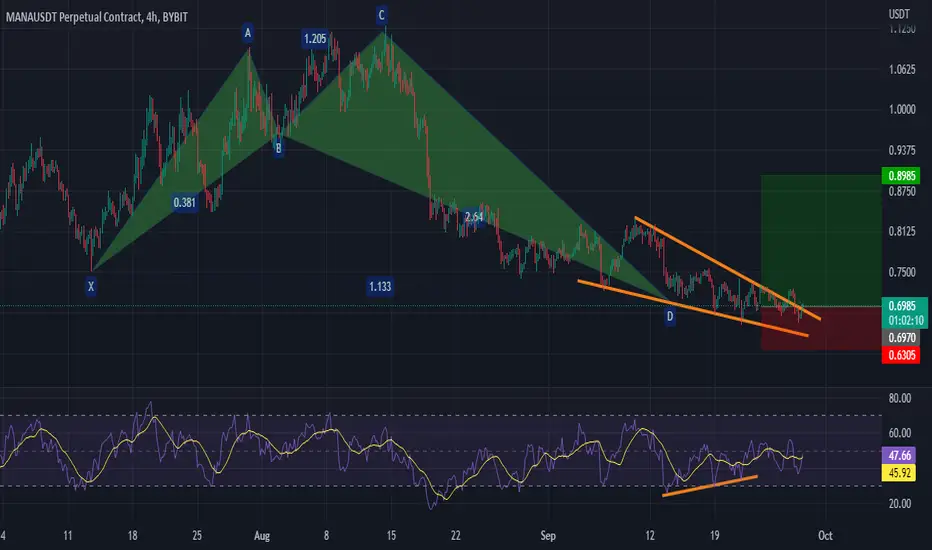
MANA is ready to move !10.9.2022MANA broke the triangle and retested the trendline. You can add more to the long position here with a tight stop loss below the $0.67 area. The resistance is $0.71 area and $0.75 area.
This Analysis will be update

MANAUSDT/D 💁🏼♀️HI
The price in the range of the box that I specified is suffering between the range of 0.67 / 0.74 the important resistance range of 0.74❗️ for a positive trend, it should stabilize above the resistance range.
According to the downward trend of the market, if we consider a downward scenario, the price can be corrected up to the ranges of 0.60/0.63. ❗️ You have to see if the price shows a reaction to this area that I specified. ❗️
what do you think about it?🙂 sell or buy?
📆✨8/10/2022✨
💁🏻✨ @MehrnaziJiTrading_crypto✨

MANA - LONG 3x option, CUP TREND(scalp)MANA has strong SUPPORT level at recent price and is more possible to have a positive LONG BREAKOUT from current triangle trend
RISK: 3% - 5%
LEVERAGE: 3x
keep in mind the less you risk the higher chance you will succed in trading market over the time you trade in your TRADING CAREER
LIMIT YOUR RISK by decreasing your greed

MANAUSDT #MANAUSDT
MACD is neutral
EMAs showing a bullish move
RSI is bullish
in daily chart time we have falling wedge pattern and realy strenght support zone that pushed the price up to 700% we are now in the same support zone buy and hold it and don't miss up
targets set at the chart

MANAUSDT #MANAUSDT
in daily chart time we have falling wedge pattern and realy strenght support zone that pushed the price up to 700% we are now in the same support zone buy and hold it and don't miss up
MACD is neutral
EMAs showing a bullish move
RSI is bullish
targets set at the chart

MANATrend line getting steeper. A dip down here does not make sense at all because it will make our trend line all crooked right before we take off.

multi timeframe analysis 🌩in my last analysis I did expect months of consolidation before more upside, I do think the end of consolidation is coming very soon now, so i thought I would post an update.

MANAUSDT - TRADE PLANCheck out the trade plan for MANA today based on the technical analysis. Hope this analysis is useful, make sure to hit the thumbs and also follow my tradingview profile for future updates. Thank you!
MANA is on a descending triangular pattern where we are waiting for the perfect breakout confirmation to hunt down the targets pinned on the chart.

The RSI Formula Explained. Catch the move from end to end.
Welcome to the copy shop everybody and let me bid you a hello from the back of the baristo bar. This video is very casual, unscripted, and yet extremely informative.
First off let me make sure you have your copy of this script "The Heiken Ashi Algo Oscillator"
I'm hoping to use this particular video so that you guys can come back into the comments area and specifically ask questions about how this works because I want to give you this information. But most importantly I want you to understand it.
In today's video I'm going to be discussing the "RSI formula". So today's video is called the RSI formula, explained.
I've noticed over the years that every time they RSI has a particular reading, You can calculate that into a ratio that will tell you what should be your risk and what should be your reward. This allows you to set your stop loss and your take profit and literally walk away and not have to worry about it. I do not expect you to understand this formula watching it just one time so you will need to play this over and over again without question. But if in the moment that you do have questions go ahead and leave them below.
What I want you to do is if you feel like you're getting it wrong, tell me what the RSI reading is that you got and I'll tell you what it's supposed to convert to and I'll tell you how to convert it to that number. Telling you the formula won't help you as much as it will showing you how it works against your readings so by all means leave your questions below.

Heiken Ashi Algo Volume Scalping StrategyHeiken Ashi Algo Volume Scalping Strategy
Welcome everybody this is your Barista Eric should I be calling it a baristo cuz Barista sounds kind of effeminate and you can tell by my voice I am not a woman.
So we got something interesting.
Today I'm going to be sharing with you a volume scalping strategy that you can use with the heiken Ashi Algo.
This is a wonderful strategy because the algo has a lot of features that plot onto its oscillator and you can actually turn most of them off you only need basically three things showing up.
To do this all you need are:
Heiken Ashi Candles
The RSI Moving Average and
RSI (relative strength index line)
So let's go into the settings. I'll show you what to do and you'll be able to get started in this in just a few minutes.
Open tradingview and go to the indicators and I'm going to type in Heiken Ashi Algo. There you will see it under the Community scripts by @coffeeshopcrypto the "Heiken Ashi algo Oscillator"
Here is a link to it
(Click there)
Add it to your chart and let's go to the settings.
In the style tab of the settings You can turn off both of the stochastics.
Also you'll notice a couple of grade out boxes to things that are not selected. The RSI upper band and the RSI lower band. These print the 70 and the 30 level on your oscillator so turn them both on. If the other bands distract you you can turn them off. These would be the 40 and 60 levels.
The last thing you want to do here is change your RSI to yellow and your RSI moving average to red.
Now let's go to the inputs tab and change your RSI to 18 and RSI Moving average to 36.
If you're trading on a higher time frame than one hour you should probably change them to 21 and 50 as a maximum..
If you're trading on a 15 minute or lower time frame you should set them to about 12 and 14 or or lower.
Also change your RSI moving average type to a volume weighted moving average.
*******************Special Note******************
I want to address a couple of questions I got since the release of the Algo and one of the questions that I tried to cover in the previous couple of videos was when someone is going to ask me "what are the best settings at certain time frames?" You have to understand there are no best settings because if you're trading in crypto against the US dollar or crypto against For example another crypto then things move differently. your settings for the US dollar can be set one way but if you're trading crypto against crypto pairs you need different settings. also the settings are really tied to the market that you are in. if you are trading on the S&P or indices or Futures your settings are different for all of those things they are not the same for either one of them and once you get into crypto the markets are so volatile that you need to watch things closely/ so I cannot tell you what are the best settings because the best settings do not exist. Choose the settings that work well for you and if they are not working well it's because the market is changing just a little bit and you need to start developing additional strategies. You can not just have one strategy that you use all the time because that will not work all the time. Markets change. They have four different versions and you need to have several strategies that will be able to address each one of those types of Market.
One of the reasons that I've created this particular indicator is because it allows you to develop several different types of strategies and this particular video is one of those strategies that you can practice and you can use from time to time when you are seeing extremely changing volumes in the market that you're in. This way you have another piece of ammunition in your pocket that you can use when your current strategy or whatever you used to using isn't working as well as it should be.

MANA - 15M bullish The price broke above resistance and had a pullback to it, so it’s a support zone now; according to the signal bar and powerful bullish candles, the possibility of rising to the next resistance level is high.

RR=3 buy ideabullish shark pattern + RSI divergence + falling wedge pattern breakout
PS : never risk more than 2 % of your capital per trade
🔥FALLING WEDGE on MANA! Don`t MISS this entry point!🔥 Hi friends! MANA is already fall from the local highs to the local bottom. The whales just need to collect the liquidity below the key level of $0.625.
If the price make a break up of the wedge it will not be the best scenario because in this case will be the collection of liquidity above the wedge which good for the short traders.
We need to have the break down of the falling wedge and return the price inside the wedge. The liquidity will be colected to long in this case.
📊 Preconditions to open a long:
🚩 false breakout with liquidity collection below the key level $0.625
🚩 volume growth that show the whales pressence and huge trading activity close to this levels
🚩 if BTC going to the 25k, the most of alts make +40-60% to its price
🚩 the whales BUY orders on the DOM and Footprint don`t allow the price fall lower
🔥 The most important tools for scalping are the DOM and Footprint. These tools allow me to see the biggest orders to but or to sell and trade the test of the WHALES orders wall.
📊 The targets:
✅ $0.76-0.87
✅ $0.97-1.03
💻Friends, press the "boost"🚀 button, write comments and share with your friends - it will be the best THANK YOU.
P.S. Personally, I open an entry if the price shows it according to my strategy.
Always do your analysis before making a trade.

mana decentraland big pump comingthere are soon a big pump coming (can take couple weeks too but it will come)

MANA/USDTMANA/USDT
It has created an upward divergence on its support.
I expect the price to increase to the one dollar area and the ceiling of the descending channel.
#MANAUSDT #MANA #BTCUSDT #BTC #ETHUSDT #DOGE #DOGEUSDT

Manausdt BinanceThe platform, co-founded by Ariel Meilich and Esteban Ordano in 2015, was launched in 2017 following a $24m initial coin offering (ICO). It was opened to public users in February 2020.
Every blockchain-based platform needs to have its own crypto, and Decentraland has the conveniently-named Decentraland token, also known by its ticker handle of (MANA). This token is used to buy and sell land, as well as goods and services, within the network.
Users can purchase the limited land in this virtual reality world and develop assets into real estate. This in turn creates a hub and drives the creation of content and services.

mana usdtMana usdt long.
high time frame divergence
low time frame divergence
minimum target 10%
stop loss in setup

Long ManaMana has a bullish Inverse H&S at the bottom of a downtrend. The height percentage of the head has a breakout target of 13% from the neckline. This breakout will test the 0.383 fib level and we will see how price reacts to it. I’m ignoring the .618 and .5 fib levels because there’s isn’t major resistance there. If you want to wait for confirmation, wait for a neckline break and ride the wave.
This chart based off of The Elliot Wave Theory, Fibonacci, EMA’s, MacD , RSI , Momentum, and resistance/support zones combined with patterns.

Is bullishness comming back? Hello everone,
In today's video we are going to talk about USDT dominance and how BTC and some altcoins are looking like.
Have a good trading week.

MATICUSDTMATICUSDT(09.10.2022 UPDATED)
Wait until price touches the trend lines then look for signal bar and key bar /Breakout and pullback to recognize direction of price movement.
Money Management must be obeyed.
Open position without setting the proper stop loss (1% or 2% of total balance ) soon or late will cause to lose all your money ( call margin )
Majority of trades is done via computer trading (forex / cryptocurrency)
priority in analyzing charts:
1- Price Action
2- Market structure
3- Chart patterns
4- Candlestick patterns
5-Divergence
6-Indicators
SETUP IN TRADING RANGE: BLSH
BLSH:BUY LOW SELL HIGH


MANAUSDTHello my dear friends
According to the formed pattern and positive divergence of RSA, it seems that the white range ($0.7307) is valid and the main upward movement will start from this range.
Keep in mind that if the corrective trend is below the price range of $0.6265, we will no longer have the mindset to form an upward trend.
We would be happy to hear your comments
