MANA breakoutPlease 1st of all smash the boost🚀 button and follow me to support my work if you like it! It's absolutely for free.
Decentraland broke up this triangle📐 and I think there is chance for run to 0.8455 and even higher. Setting BUY LIMIT order to previous range high to catch🎣 the pullback. The white uptrendline could be a good guide.
ENTRY : local high @ 0.7969
STOPLOSS (SL) : local low @ 0.7817
TARGET (TP) : height of the triangle projected from midpoint of the local range (BUY LIMIT - STOPLOSS) @ 0.8455
REWARD RISK RATIO (RRR) : 3.2
INVALIDATION : when SL level hit
Check my other stuff in related ideas.
Please boost🚀, comment🗣️, follow me✒️, enjoy📺!
⚠️Disclaimer: I'm not financial advisor. This is not a financial advice. Do your own due dilingence.
MANAUSDT trade ideas

MANA Potential Short / LongThe above chart is based on symbol MANAUSDT - Binance.
Alerts have been set.
The trading plan is to ladder in 0.25% below Entry, on Entry and 0.25% above entry.
Stoploss(SL) is at 1.5%.
Risk Management is always important. Let the trade come to you.
Take Profits(TP) at 1% increments.
First TP1 will have a higher percentage of take profit.
If/when TP1 is hit, SL will be move to entry.
Do Techincal Analysis(TA) stick to your plan, let the trade come to you, and don't FOMO, if your plan does not come to fruition (not hit) then you have not lost any money, have a SL to ensure best practice so you can continue trading, journal your trade for self development and reflection.

MANAUSDTMANAUSDT(09.03.2022 UPDATED)
Wait until price touches the trend lines then look for signal bar and key bar /Breakout and pullback to recognize direction of price movement.
Money Management must be obeyed.
Open position without setting the proper stop loss (1% or 2% of total balance ) soon or late will cause to lose all your money ( call margin )
Majority of trades is done via computer trading (forex / cryptocurrency)
priority in analyzing charts:
1- Price Action
2- Market structure
3- Chart patterns
4- Candlestick patterns
5-Divergence
6-Indicators
SETUP IN TRADING RANGE: BLSH
BLSH:BUY LOW SELL HIGH

MANA/USD Going shortI am going short because my technical analysis says its time to short. In this analysis i will be skipping fundamental analysis because this is only 4 hour chart. Also the market is somewhat bearish, therefore my sentimental analysis is right.

MANA - Quick 3 % Scalp Hi Guys,
If MANA manage to break the white line....
I think it will give a quick 3 % up.
No finacial Advice !
DYOR ;)
I am Off, Cheers !

📊 MANA: wait fot this trendline breakout! Hi friends! MANA is going to break the trendline. But i recommend you to wait for some pullback to the key level of $0.754. Someone who enter the trade on this local pullback will be traped and you will enter the trade with less risk and nice risk reward.
Recently, MANA made a false breakout of the key level of $0.754 and price rised by +8%. If you miss this opportunity, use this preconditions to open the next long:
🔥 return to the key level $0.754 and squeeze to the trendline
🔥 volume growth
🔥 bullish BTC
🚩 DOM and Footprint indicators show me the whales buy orders close the key level or before the trendline breakout and it will be the MAIN precondition to enter the long for me!
📊 The targets:
1. $0.81-0.87 - the value area and closest resistance
2. $1.13 - the key level and mid-term target
💻Friends, press the "boost"🚀 button, write comments and share with your friends - it will be the best THANK YOU.
P.S. Personally, I open an entry if the price shows it according to my strategy.
Always do your analysis before making a trade.

MANAUSDT0.618 Retrace Likely
Stochastic looks bullish and has some room to move up from over sold area

🔥 MANA Fell Through Support: New Lows IncomingMANA has been trading alongside a very precarious support line for around two months. However, said support line was broken on last Friday's sell-off.
This means that, for now, the bulls have lost the upper hand and the bears are in control. In my view, it's highly likely that we're going to see new lows coming, think $0.6
We're either going to re-test the previous support as resistance, or we will grind downwards from here.

An elliot wave scenario for MANAMANA has shown that the bulls' strength overcomes the bears' strength at each key reversal point. This wave pattern is possible with the first target 9.75 and the second target 13.2.
The price should reverse up from 3.6 and if it stays below 3.6, this scenario is no longer valid.

MANA/USDT (Short) - bear flag; shorter-term trade ideaLast week, BTC, along with the rest of the crypto market, experienced a sharp drawdown. After a week-long consolidation, the next move truly hinges on today's Jackson Hole speech (10:00am ET). The central bank chairman is expected to comment on the current state of the economy and tell us more about the central bank's next steps in the fight against inflation. There are two base outcomes we can expect:
1. He will sound dovish - economists are seeing serious cracks in the overall economy, and they wish to slow down with financial tightening (not stop it completely); this would be very positive for crypto
2. He will sound hawkish - the inflation is still too high, and they have no intention of stopping tightening even at the expense of the economy; the negative outcome for crypto
We would prefer to bet on the short side as we believe that the market got optimistic a bit too early, and central bankers are likely to set them straight. For this bet, I chose a token which performed relatively worse during the consolidation period. MANA painted a clear bear flag which is likely to break to the downside. We can see that MANA was slowly drifting downwards during the consolidation (red parallel area) while tokens like ETH had a nice rally. The weak relative strength shows a clear negative sentiment.
The strategy would be to wait for the meeting outcome and once the token breaks the trend line to the downside, go short . The profit target would be either the light green line (less risk) or a bit lower support at $0.6290 (more risk). As a stop loss , I would use the upper side of the channel (red line) or the actual entry point if you wish to take less risk. The reverse case would be if the speech boosted the whole market. In that scenario, we would either leave this trade or find a different, relatively strong token and play on the long side.
Happy trading!
Best wishes,
Dollero Technology

MANAusdt 12H TA: TrendLine SupportAccording to the falls of this week, the price is on the important support area and the support of the trend line, and we consider two possible scenarios regarding this area in the chart.
Its not Buy or Sell SIGNAL
DYOR
BY : Mohamad Teriz - @AtonicShark


MANAUSDTMANAUSDT(08.20.2022 UPDATED)
Wait until price touches the trend lines then look for signal bar and key bar /Breakout and pullback to recognize direction of price movement.
Money Management must be obeyed.
Open position without setting the proper stop loss (1% or 2% of total balance ) soon or late will cause to lose all your money ( call margin )
Majority of trades is done via computer trading (forex / cryptocurrency)
priority in analyzing charts:
1- Price Action
2- Market structure
3- Chart patterns
4- Candlestick patterns
5-Divergence
6-Indicators

MANA's search for meaningThe MANA 74 Cent level is the strongest support. It is a coin that has spent a lot of time here in the past, then flew away with the metaverse current and came to the same levels again. Level 94 is unfortunately broken. Currently, the 84-74 range seems to be an ideal accumulation area. From this range, preferably close to 74 areas, the risk-reward ratio will be the highest level. The 1.12-1.37-1.68 levels are the biggest resistances in front of them, but after these resistances are broken, the 1.12 resistance is likely to make a quick premium.

MANA/USDTMANA/USDT
It is in a long-term downtrend.
It has broken its internal uptrend line.
It has the possibility of falling to the level of 75 cents.
#MANAUSDT #MANA #BTCUSDT #BTC #ETHUSDT #DOGE #DOGEUSDT
mana Enter 1 : 2.6445
enter 2 : 3.0530
T1: 3.5544
T2: 3.9879
T4: 4.6403
T5: 5.4071
stop: 1 day close under 2.2025

Ascending Triangle Pattern on MANAHello guys today i saw an interesting Ascending Triangle pattern on MANA , it will be a good setup.
wait until break out between 1.0500 and 1.0700 , the open your short position after first candle.
the target is 1.0000 , you can close 50% of your position and risk free that.
remember funda analysis before opening a position.
it's just an idea , always do your research and analysis.
don't forget to follow and boost this idea :) thank you.

MANA long term opportunityChart analysis is simple, it has the potential to simply follow the ascending channel. I don't publish the wave analysis for the sake of clarity but may 22' indicates the end of 2 years cycle. A strong downward breakout invalidate the pattern but chances are low. I think Decentraland (MANA) is a well established crypto project, it has real utility but right now is undervalued. MANA has an established metaverse and far more succesful altcoins are promising a metaverse... I can't see strong reasons to this project falling into oblivion.

MANAUSDTMANAUSDT(08.14.2022 UPDATED)
Wait until price touches the trend lines then look for signal bar and key bar /Breakout and pullback to recognize direction of price movement.
Money Management must be obeyed.
Open position without setting the proper stop loss (1% or 2% of total balance ) soon or late will cause to lose all your money ( call margin )
Majority of trades is done via computer trading (forex / cryptocurrency)
priority in analyzing charts:
1- Price Action
2- Market structure
3- Chart patterns
4- Candlestick patterns
5-Divergence
6-Indicators

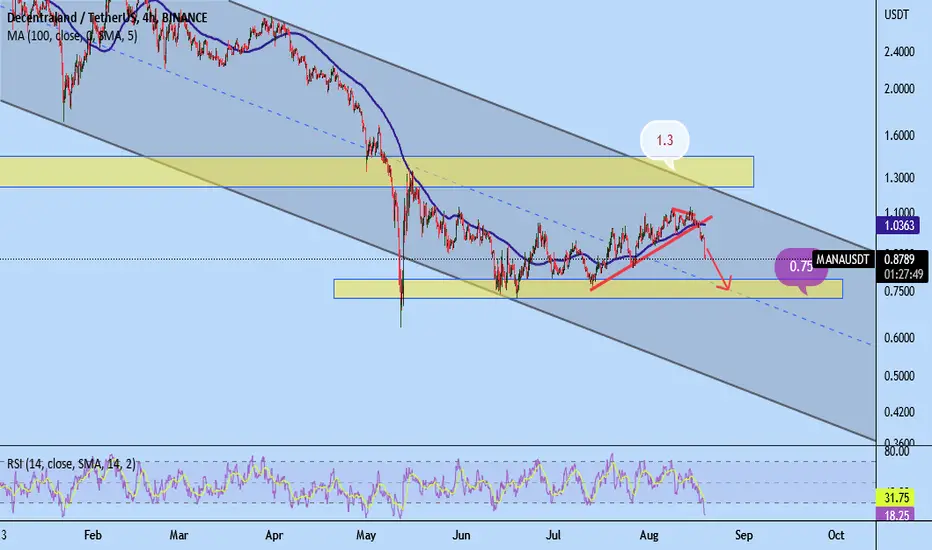
MANA/USDTMANA/USDT
It is in a descending channel.
It has an internal uptrend line that has reacted to it several times.
It is expected that we will increase the price up to the ceiling of the channel and the range of 1.3 dollars.
#MANAUSDT #MANA #BTCUSDT #BTC #ETHUSDT #DOGE #DOGEUSDT

Decentraland MANA Entry Range, Take Profit and Stop LossMANA/USDT
Entry Range: $1.00 - 1.13
Take Profit 1: $1.30
Take Profit 2: $1.52
Take Profit 3: $1.73
Stop Loss: $0.84

MANA/USDT: Bullish reversal tentative - 1,20 to watch---- Mid-term Analysis for the next coming 4 weeks to 3 months - Based on Daily Chart -------
MANA/USDT: Bullish reversal tentative - 1,20 to watch
Context
- The Global Crypto market leads by BTC and ETH reversed a new bullish trend - BTC and NFT/METAVERSE COIN remains in underperformance versus ETH.
- We are watching at 1,20 to bypassed to extend the bullish recovery in progress
Market configuration
- Graphical Elements :
Graphical support = 0,99 & 0,7990
Graphical Resistance = 1,20 & 1,95
- Mathematical Indicators:
EMA ( Exp Moving averages) are support at 0,99 = Bullish
RSI indicator (below) is now above 50% with room to the upside = Bullish
- Elliot & Harmonic Wave (Fibonacci):
A last drop to draw the wave (C) B is now completed - the market is now bouncing off in recovery
Fibonacci resistance of the wave = 1,20
Fibonacci bullish wave target at 1,95
Fibonacci bullish wave support at 0,7980
Fibonacci bearish wave target at 0,5940
Conclusion
Prefered case => As long as 0,7980/0,99 remains support a larger recovery towards 1,20 is expected with strong conviction, only a break above 1,20 will open a direct recovery potential towards 1,95
Alternative case => Breaking 0,7980 a new bearish attack towards 0,5940 will occur
