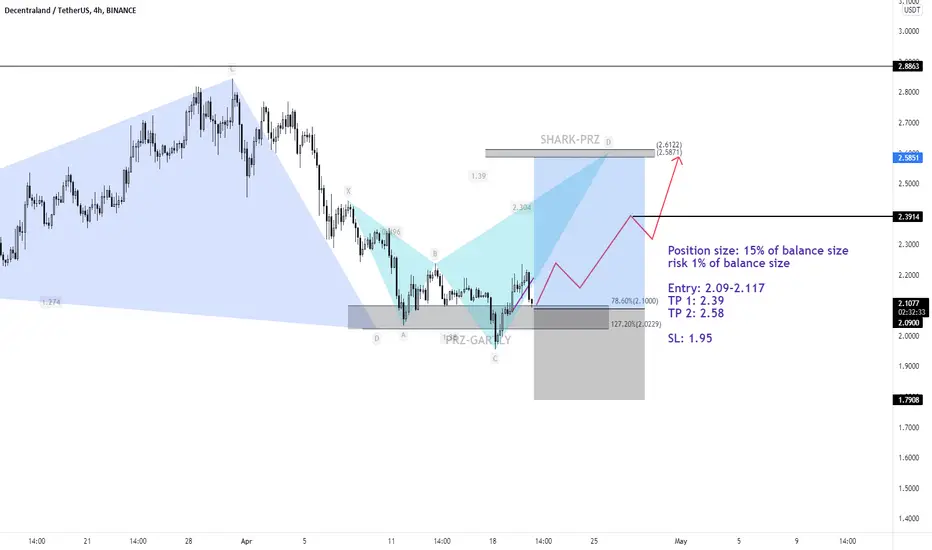
MANAUSDTPosition size: 15% of balance size
risk 1% of balance size
Entry: 2.09-2.117
TP 1: 2.39
TP 2: 2.58
SL: 1.95
MANAUSDT trade ideas
MANAUSDT LONGPosition size: 15% of balance size
risk 1% of balance size
Entry: 2.09-2.117
TP 1: 2.39
TP 2: 2.58
SL: 1.95

💡Don't miss the great buy opportunity in MANAUSD @decentraland
Trading suggestion:
". There is a possibility of temporary retracement to the suggested support line (2.1111).
. if so, traders can set orders based on Price Action and expect to reach short-term targets."
Technical analysis:
. MANAUSDT is in a range bound, and the beginning of an uptrend is expected.
. The price is below the 21-Day WEMA, which acts as a dynamic resistance.
. The RSI is at 49
Take Profits:
TP1= @ 2.2406
TP2= @ 2.3572
TP3= @ 2.5255
TP4= @ 2.6673
TP5= @ 2.8482
SL= Break below S2
❤️ If you find this helpful and want more FREE forecasts in TradingView
. . . . . Please show your support back,
. . . . . . . . Hit the 👍 LIKE button,
. . . . . . . . . . Drop some feedback below in the comment!
❤️ Your support is very much 🙏 appreciated! ❤️
💎 Want us to help you become a better Forex / Crypto trader ?
Now, It's your turn !
Be sure to leave a comment; let us know how you see this opportunity and forecast.
Trade well, ❤️
ForecastCity English Support Team ❤️


MANA double bottom and falling wedge Good day,
We are looking at the one day chart of MANA//USDT
As we can see, a double bottom has formed within a falling wedge.
The above could mean bullish
Good day!

MANA MANA is progressing in side an big descending channel. For now we see a bearish flag with two strong resistance and ichimoku cloud is also acting as resistance.
Buy @ 2.2 - 2.25
TP1: 2
TP2: 1.8
TP3: 1.7
TP4: 1.6
TP5: 1.22
STOPLOSS: 2.3

MANA / USDT Support & Resistances - NewUpdated Daily Technical Outlook with possible targets - 15.04.2022

MANAUSDTMANAUSDT is converging into a symmetrical triangle on 8H chart.
Trade Plan A:
Buy
Enter on bullish signal after upper trend line is broken
SL at 2.25
TP1 at 3.53
TP2 at 4.36
Trade Plan B:
Short
Enter on bearish signal after lower trend line broken
SL at 2.25
TP1 at 1.65
TP2 at 1.22

Sure ShortA clear bearish flag breakdown is telling the whole story, $MANA is already moving for short. #dyor

Decentraland (MANA) Launches its Desktop Client. How is it?Decentraland recently released its beta version of the desktop client - how does it look in its current state?
From egamers.io:
"Players will now experience performance enhancement upgrades with cleaner graphics, faster processing speeds, and improved stability by adding the client’s option.
The client is only available for Windows in beta, with the developers welcome any feedback while more operating systems will come shortly."
egamers.io
The client allows for faster processing speeds, lower loading times, and opens up bigger possibilities for content creators to do things on the metaverse in ways that were previously not possible on browser-based platforms.


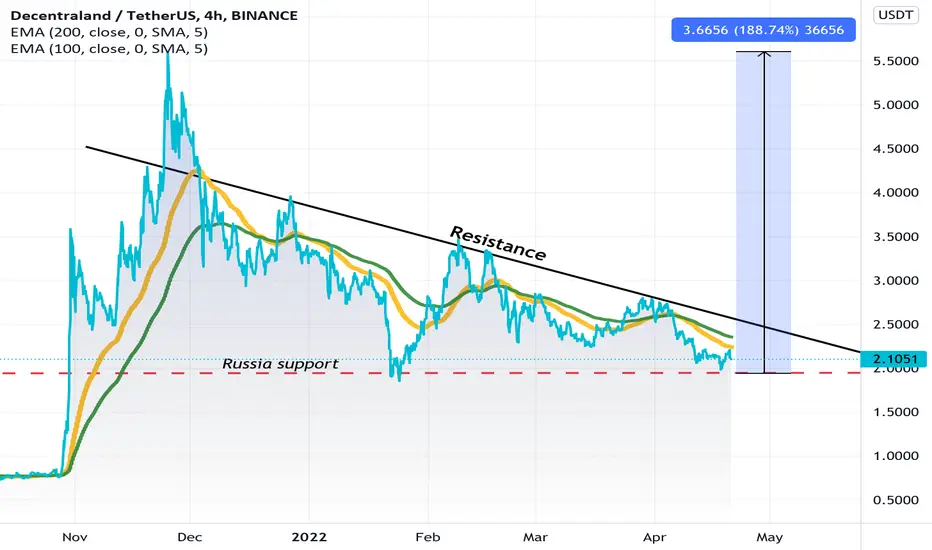
MANA May have Pump in this month!It is close to break its bearish trendline, keep your eyes on MANA!

MANA trend follow shortPrice broke below very important area of support around 2.20 - 2.24 with an impulsive candle. Price then retested support turned resistance with a bearish flag, broke trend line with a high volume bearish engulfing candle on the 1h chart.
Stop loss: above resistance, recent highs
Take profit: at 1.5 fib extension level, acts as level of structure to the left

Decentraland (MANA)If it closes below $ 2.2-2.5 during the weekly time, a fall is very likely.
(Personal archive for situation review and troubleshooting, watchlist.)

Short $mana Decentraland $Mana (Decentraland) is in a long downward trend against USDT, towards -99% in my opinion
My thesis is built upon stalling user activity; stalling "metaverse narrative"; poor in-game experience (in my opinion); bearish tokenomics
I'm SHORT as follows:
Entry: 2.638
Liquidation: 3.099
Leverage: 5x
Margin(USDT): 1269.67
Take Profit @ 2.060

TRADE PLAN FOR MANA FOR PROFITShello guys, we follow the chart and takes what it gives us, we stick to our trade plan and follow dollar cost averaging concept.
from the chart MANA is bouncing off support and we expect a test of the trend resistance line. a breakout will take us to the channel .
Tradehubng

MANA/USDT BINANCE H1 Falling Wedge (active) [Decentraland]MANA/USDT BINANCE H1 Falling Wedge (active)
A Falling Wedge is activated
Targets are displayed as green horizontal rays
Longterm, Midterm and Shortterm view Fibonacci Retracement Levels are displayed as horizontal lines
Historical Monthly Highs and Lows are displayed as horizontal lines
This Pattern is part of a bigger bearish pattern, see active Bearish Pennant

MANA/USDT BINANCE D1 - Bearisch Pennant (active)MANA/USDT BINANCE D1 - Bearisch Pennant
a Bearisch Pennant was activated today
Targets are marked as horizontal rays in green

MANAUSDT -- 4HHey guys
It is time to invest in some coins and tokens according to their technical and fundamental conditions.
here is the third one I have orders according to the key levels shown in the chart.
DYOR!
This is my idea. not a financial advice.
like and share and comment the coin or token you want me to share my technical point of you of them
Good luck

