MANAUSDT - FinalsP.S. Always do your own analysis before a trade. Put a stop loss. Fix profit in parts. Withdraw profits in fiat and reward yourself and your loved ones
MANAUSDT_0BF6D9 trade ideas


PREPARING FOR A MANA LONG Looking at the MANA/USDT pair today, Lets get it!
Chart above us shows that we have a first wave extension impulse in play. As shown by the first fibonacci tool, we found support at the .382 region marking the end of wave 2 and made new ath's at the 1.5 fib region(just under the 1.618) for a wave 3 top before clearly getting rejected as shown by the 2nd fibonacci retracement tool.
Currently still in the correction phase of wave 4, MANA seems to be baiting everyone into buying and longing here, however the chart below shows us with the angles presented that this isnt the bottom and that we will most likely still go to the bottom of the ascending channel before getting a reversal for our wave 5 impulse
Once we confirm our Wave 4 bottom, target for our wave 5 will be the touch of the channel resistance once more and should be inline with either the 1.9 or 2.0 fib resistance, leaving us with a price target in the range of $15-20 depending on how early we can achieve that.
If you agree with this idea, leave a like and share your thoughts in the comments
Feedback is always appreciated.

#MANAUSDT 2H Chart
Price reached the major 12h demand zone from where it is bouncing from. MACD is beginning to show some bearish weakness, RSI is oversold and EMAs are bearish. Price needs to break above the 2h supply for short term bullish confirmation and we would then aim towards the daily supply zone.

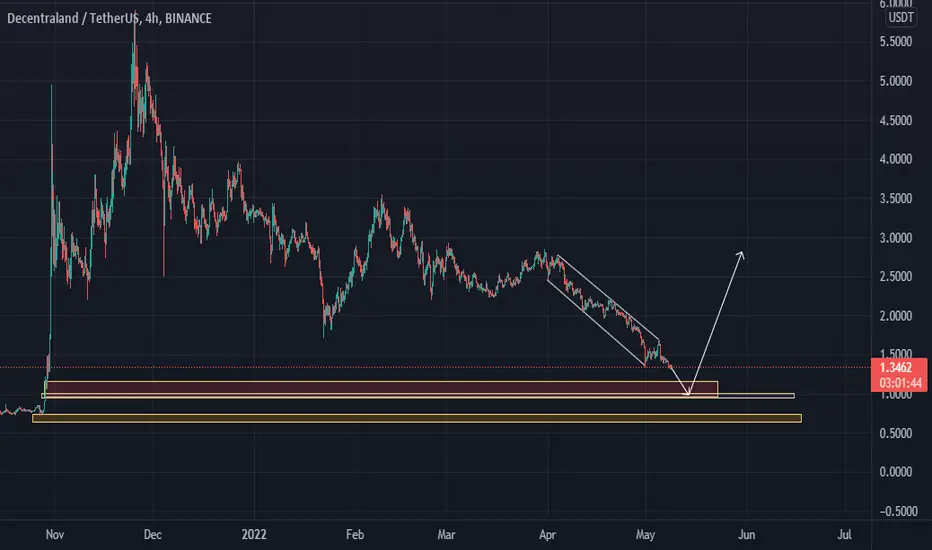
MANAUSDT is testing creating a bearflag
The price is testing the monthly support after a bounce on the monthly support on 1.45$
on the daily timeframe the price lost the support and now the market wants to retest it.
on the 4h timeframe the price is creating a bearflag below the weekly resistance.
how to approach it?
IF the price is going to have a breakdown from the bearflag, According to Plancton's strategy , we can set a nice order
–––––
Keep in mind.
🟣 Purple structure -> Monthly structure.
🔴 Red structure -> Weekly structure.
🔵 Blue structure -> Daily structure.
🟡 Yellow structure -> 4h structure.
–––––
Follow the Shrimp 🦐

MANANot financial advice.
The essence of investing & trading is the intelligent and patient preying on the greed, fear, impatience, addiction and ignorance of the majority. It's definitionally Darwinian.

MANA MACRO ANALYSIS - (DECENTRALAND)Happy New Month Everyone.
We will be looking at MANA/USDT today.
In our past analysis we managed to predict the drop on mana and identified areas to get into a long position, however price missed by a few digits (need to learn to market buy more often). Today we will have another go at longing mana.
As you know the last analysis was based off the First Wave Extension Theory which still remains the same. You can read up on the previous analysis for more details:
Current Analysis:
Not much to explain really. Judging by the chart above, we can expect price to make new ath's this year around early July to September depending on how Bitcoin & Ethereum behave in weeks to come.
Longest duration for price to peak was the 1st wave which having the highest %growth makes sense, followed by a correction of -77%.
Wave 3&4 have had similar timeframes to conclude their tops and bottoms, as well as -70%+ corrections, so we can expect the same for wave 5.
PS: I was expecting a drop to the 1.6 region in January with 1.3 being the worst case scenario, try and keep that in mind and remain on guard. Other than that, I'm happy to average in at these prices.
If you agree pls leave a like and share your views as well in the comments.
Feedback is always appreciated.

MANA/USDT SCALPING SETUP$MANA follow BTC retest after breakdown
Buy zone : 1.165 - 1.1
Target : 1.2481 - 1.3069 - 1.3752
Stop : 1.06

MANA in decissive zone - sell-off or reversal?MANA will arrive decissive zone in 1.1 area where longterm-uptrend should hold to give us some upside-momentum.
2 TPs possible for me - consider your stop-loss in case we break towards south. Good luck

DecentralandMANA/USDT comming pushing down trend and i waiting until 1$ and waiting for retest if not support on 1$ next target is 0.70
MANAUSDT 15M#MANAUSDT 15M
Hello my friends
It has a good long position
Targets were identified in the photo

MANA LONGTrying out breakout strategy. Let me know if my analysis is incorrect so that I can learn and improve. Happy Trading!

MANA setup for LongMANA will rise like Phoenix *Burnt from the Ashes*
This is not a financial advice.

MANA ROAD MAPMANA IS READY. big bullish potential is clear
Entry : 1.36 1.47
Targets : 1.54 1.58 1.67 1.8 1.96 2.12 2.4 3
Stop loss : 1.23
worthy for 4x leverage
2022-05-02 (360)

🔥 MANA Massive Oversold Bounce: Bullish Times AheadMANA has been one of the main tokens that I've been watching over the last couple of days. Main reason being that MANA was recently severely oversold on the daily chart. Since MANA arrived on Binance, the RSI hasn't been so low yet.
With a bullish reaction to the FED, I'm expecting this oversold bounce to play out well. Target would be the top of the descending channel.

ABSOLUTELY LONGHi Friends..Some people try. to make you sell in this. positiion..Dont believe them..That s. why. I. pulbish this. idea.. Mana is one of the best oppurtunity to buy just. now..Above here. is. 3D 1 year. chart. and it is just right time to buy..Happy trading

Mana usdt Here a free trade for you guys , hope it helps . There will be a big bounce between .9945 and $1. Targets on the chart .


MANA Chart AnalysisIts looking lovely for that exponential growth. Lots of coins going up in this format

MANAUSDT UPDATEMulti timeframe price action perspective on MANA, expecting sooner or later a weekly relief bounce and correction after such bearish impulsive moves but for now there are no confirmations for us to be looking at taking this trade everything is bearish and we will follow the trend and continue to look for intraday shorts, atleast until we hit our demand zone and grab the liquidity below the lows.

ManaUsdtWith the current residence at about 1.35
we are going up if we get pass the closing of the previous day then we are even going higher to 2.1
if not then my best bet is to take profit within 1.63 - 1.65 region
BINANCEUS:MANAUSDT


