MANTA/USDT +100% has been in a downtrend for near 500 days, but the last 100 days show clear signs of reversal. Price has been ranging between the $0.15–$0.30 zone, indicating accumulation. Now it appears to be gearing up for a trend reversal, with the first breakout leg likely to lead into a much bigger move.
Related pairs

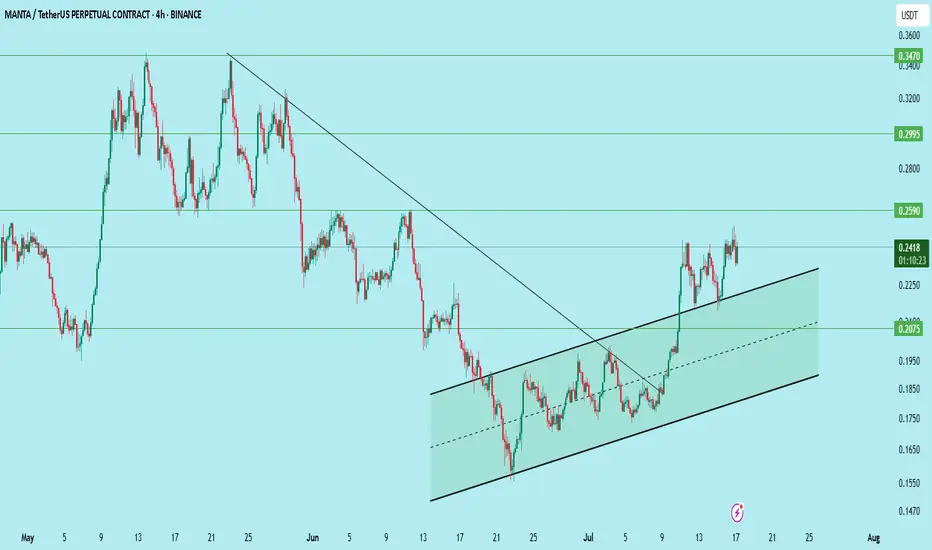
MANTA/USDT – Bullish Setup AlertMANTA has broken out of its long-term downtrend and is now trading within a clear rising parallel channel on the 4H chart.
Structure:
Downtrend broken
Higher highs and higher lows forming
Price respecting channel boundaries
Setup:
Entry: 0.225 (wait for retest)
Stop Loss: 0.2075
Target 1: 0.259
Ta
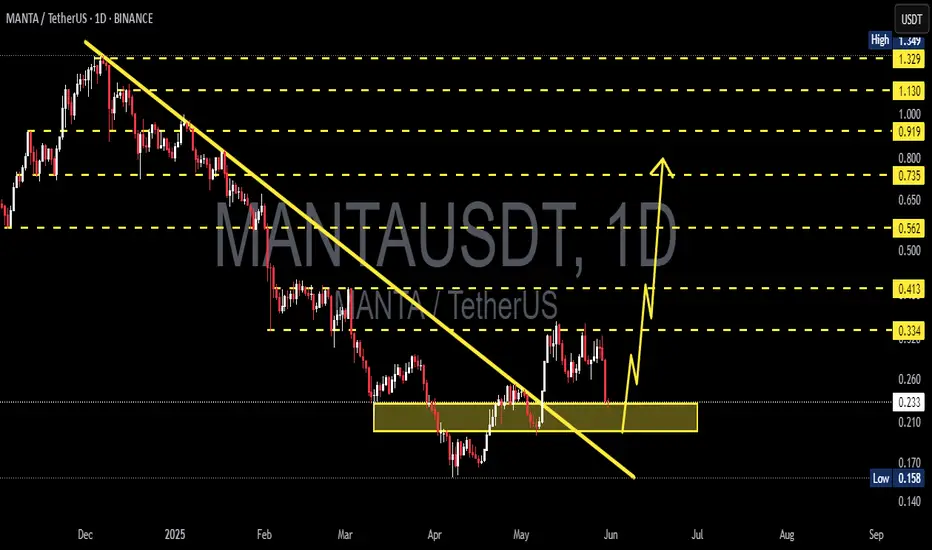
MANTAUSDT 1D#MANTA has broken above the descending resistance on the daily chart, and the retest has been successfully completed. It is now facing the daily SMA100.
In case of a breakout above it, the targets are:
🎯 $0.269
🎯 $0.338
🎯 $0.393
🎯 $0.448
🎯 $0.527
🎯 $0.628
⚠️ As always, use a tight stop-loss and ap

MANTAUSDT Forming Descending ChannelMANTAUSDT is shaping up to be one of the more intriguing setups in the market right now, showing a well-defined descending channel pattern. This technical formation often signals a healthy consolidation phase within a broader trend, creating a launchpad for an eventual breakout. With trading volume

MANTA Holding Rising Support — Eyes on BreakoutMANTA is once again respecting the rising support line and showing early signs of holding the structure.
Price action remains constructive — despite recent volatility, buyers are still defending the trendline well. As long as this rising support continues to hold, the setup remains bullish.
The ne

MANTAUSDT 1D AnalysisMANTA ~ 1D Analysis
#MANTA If you are interested in this coin, maybe you can consider this support to start buying back from here with a short-term target of at least 15%+
#MANTA/USDT#MANTA
The price is moving within a descending channel on the 1-hour frame, adhering well to it, and is heading for a strong breakout and retest.
We are seeing a bounce from the lower boundary of the descending channel, which is support at 0.290.
We have a downtrend on the RSI indicator that is ab

Manta Classic Bullish Signals = Bull Market Confirmed—PP: 1900%This analysis can be used not only to spot the trading opportunity that is now MANTAUSDT, but also for learning purposes. Let's go back to basics.
Here MANTAUSDT is breaking daily above EMA55. This break is happening with a full green candle and yesterday's candle also closed full green. Today's fu

MANTA DID 50% PROFITLast month it was shared as swing trade and now its 50% up and huge profit target done.

MANTAUSDT 1D#MANTA has broken above the descending resistance and is now facing the daily MA100. A breakout above the MA100 could trigger the following targets:
🎯 $0.331
🎯 $0.439
🎯 $0.613
⚠️ Use a tight stop-loss.

See all ideas
Summarizing what the indicators are suggesting.
Oscillators
Neutral
SellBuy
Strong sellStrong buy
Strong sellSellNeutralBuyStrong buy
Oscillators
Neutral
SellBuy
Strong sellStrong buy
Strong sellSellNeutralBuyStrong buy
Summary
Neutral
SellBuy
Strong sellStrong buy
Strong sellSellNeutralBuyStrong buy
Summary
Neutral
SellBuy
Strong sellStrong buy
Strong sellSellNeutralBuyStrong buy
Summary
Neutral
SellBuy
Strong sellStrong buy
Strong sellSellNeutralBuyStrong buy
Moving Averages
Neutral
SellBuy
Strong sellStrong buy
Strong sellSellNeutralBuyStrong buy
Moving Averages
Neutral
SellBuy
Strong sellStrong buy
Strong sellSellNeutralBuyStrong buy
Displays a symbol's price movements over previous years to identify recurring trends.
Frequently Asked Questions
The current price of MANTA / TetherUS (MANTA) is 0.244 USDT — it has risen 7.49% in the past 24 hours. Try placing this info into the context by checking out what coins are also gaining and losing at the moment and seeing MANTA price chart.
MANTA / TetherUS price has fallen by −1.21% over the last week, its month performance shows a 41.04% increase, and as for the last year, MANTA / TetherUS has decreased by −75.65%. See more dynamics on MANTA price chart.
Keep track of coins' changes with our Crypto Coins Heatmap.
Keep track of coins' changes with our Crypto Coins Heatmap.
MANTA / TetherUS (MANTA) reached its highest price on Mar 12, 2024 — it amounted to 4.086 USDT. Find more insights on the MANTA price chart.
See the list of crypto gainers and choose what best fits your strategy.
See the list of crypto gainers and choose what best fits your strategy.
MANTA / TetherUS (MANTA) reached the lowest price of 0.050 USDT on Jan 18, 2024. View more MANTA / TetherUS dynamics on the price chart.
See the list of crypto losers to find unexpected opportunities.
See the list of crypto losers to find unexpected opportunities.
The safest choice when buying MANTA is to go to a well-known crypto exchange. Some of the popular names are Binance, Coinbase, Kraken. But you'll have to find a reliable broker and create an account first. You can trade MANTA right from TradingView charts — just choose a broker and connect to your account.
Crypto markets are famous for their volatility, so one should study all the available stats before adding crypto assets to their portfolio. Very often it's technical analysis that comes in handy. We prepared technical ratings for MANTA / TetherUS (MANTA): today its technical analysis shows the buy signal, and according to the 1 week rating MANTA shows the sell signal. And you'd better dig deeper and study 1 month rating too — it's neutral. Find inspiration in MANTA / TetherUS trading ideas and keep track of what's moving crypto markets with our crypto news feed.
MANTA / TetherUS (MANTA) is just as reliable as any other crypto asset — this corner of the world market is highly volatile. Today, for instance, MANTA / TetherUS is estimated as 5.33% volatile. The only thing it means is that you must prepare and examine all available information before making a decision. And if you're not sure about MANTA / TetherUS, you can find more inspiration in our curated watchlists.
You can discuss MANTA / TetherUS (MANTA) with other users in our public chats, Minds or in the comments to Ideas.