MAPS Up 650%MAPS up 650% from bottom. Given the low volume on the candle, I'm not convinced it is the bottom. Seems like it will continue slowly bleeding, not much of interest at all. Fundamentally, with the FTX issues and their connection to MAPS, it seems like a lost cause.
Key stats

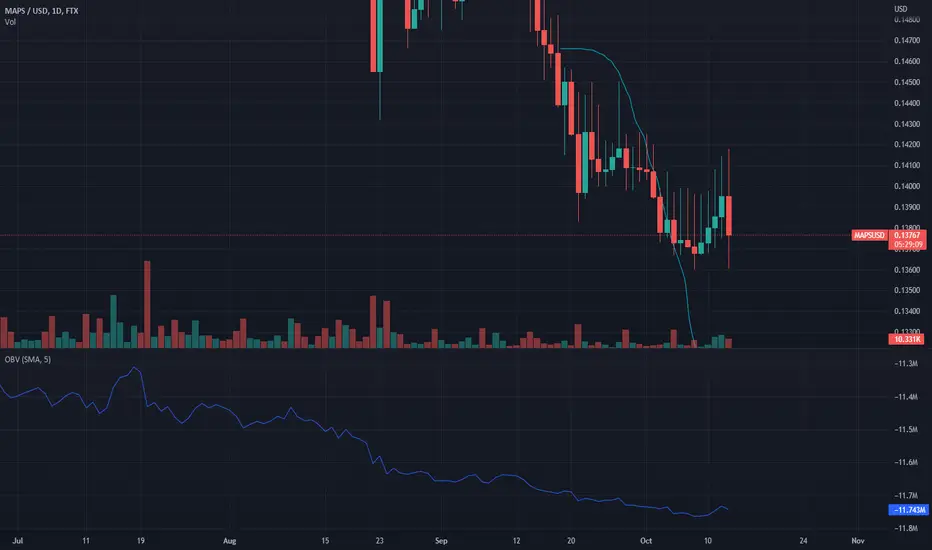
MAPS BottomMAPS coming up to the exact bottom price and timing I drew in mid-September. Could be a buying opportunity if it holds the lows.

MAPS Upper ShadowsLook at those upper shadows on the MAPS Daily Chart. Just an observation - it really cannot break out.
MAPS BottomMAPS is an interesting coin because it bottomed in January 2022, and had a 2600% rally through April. Reaching the 9 cent area again would pose a reasonable risk/reward, but is definitely not a guaranteed trade.

maps 1h shortSetup: Maps has just broken down from its support, signaling a new trend to come.
Entry: 0.2702
Trailing SL: 1 ATR above the 9 EMA( currently at 0.2925)
TP: 0.1

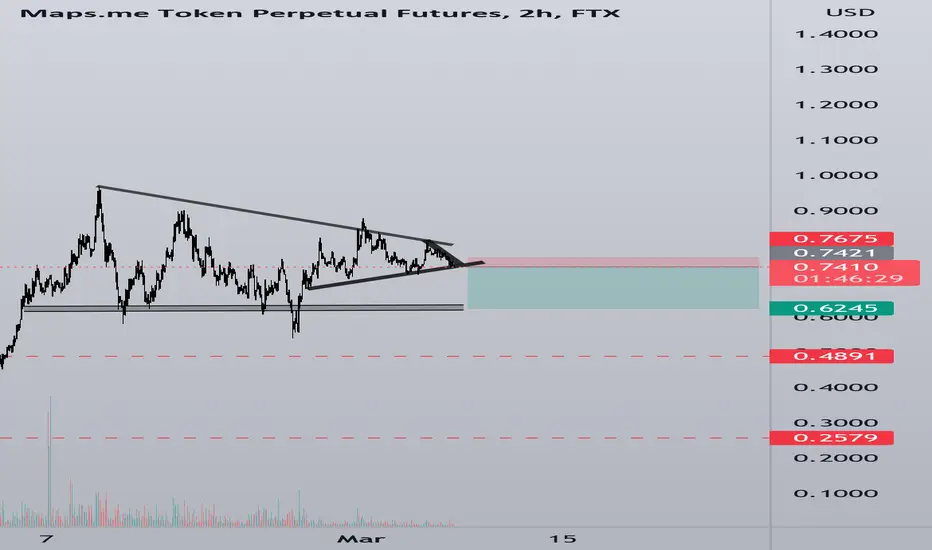
Maps is at a very crucial resistance area. Maps has made a parabolic move to the upside almost 12X in just 54 days. But if you look at the larger picture it has been in a downtrend. Its been making lower highs. Also made a lower low since the beginning of the chart. This recent move also looks like a 3 wave move to me.
Currently its sit

Class B Hidden Bullish Divergence at 200SMANormally I'd look for more but this coin doesn't tend to need much of a spark to continue it's rise so i will be targeting near the highs on this trade.


MAPS mega rally losing steam SHORT Background:
MAPS has rallied far harder than the rest of the crypto market posting ~8x in 2 weeks. Given that Bitcoin is now trading under resistance (bearish short term thesis for all crypto positions), a hard pullback in MAPS seems likely. Bearish divergence on the H4 RSI coming down from "overbou

See all ideas