DAX INTRADAY corrective pullback, Key level to watch 23680Trend Overview:
The DAX Index remains in a bullish trend, supported by a series of higher highs and higher lows. The broader structure continues to favour the upside, although recent intraday price action suggests a sideways consolidation, signalling a potential pause within the prevailing uptrend.
Key Support and Resistance Levels:
Support: 23680 (key pivot), followed by 23445 and 23200
Resistance: 24570 (initial), then 24770 and 25000
Technical Outlook:
A pullback toward the 23680 support—which aligns with the prior consolidation zone—could offer a buying opportunity if price action confirms a bullish reversal from that level.
A sustained break above 24570 would likely accelerate bullish momentum, targeting 24770 and 25000 over the medium term.
Conversely, a daily close below 23680 would invalidate the bullish bias, exposing the index to a deeper retracement toward 23445 and potentially 23200.
Conclusion:
While the broader DAX trend remains bullish, traders should watch for price behavior around the 23680 level. A bounce could resume the uptrend toward 25000, but a confirmed breakdown would shift the short-term bias to bearish, signaling a deeper correction.
This communication is for informational purposes only and should not be viewed as any form of recommendation as to a particular course of action or as investment advice. It is not intended as an offer or solicitation for the purchase or sale of any financial instrument or as an official confirmation of any transaction. Opinions, estimates and assumptions expressed herein are made as of the date of this communication and are subject to change without notice. This communication has been prepared based upon information, including market prices, data and other information, believed to be reliable; however, Trade Nation does not warrant its completeness or accuracy. All market prices and market data contained in or attached to this communication are indicative and subject to change without notice.
DE30 trade ideas

Bullish bounce off pullback support?GER40 has bounced off the support level which is a pullback support that aligns with the 50% Fibonacci retracement and could rise from this level to our take profit.
Entry: 24,101.42
Why we like it:
There is a pullback support level that lines up with the 50% Fibonacci retracement.
Stop loss: 23,934.55
Why we like it:
There is a pullback support level that is slightly above the 78.6% Fibonacci retracement.
Take profit: 24,396.66
Why we like it:
There is a pullback resistance level.
Enjoying your TradingView experience? Review us!
Please be advised that the information presented on TradingView is provided to Vantage (‘Vantage Global Limited’, ‘we’) by a third-party provider (‘Everest Fortune Group’). Please be reminded that you are solely responsible for the trading decisions on your account. There is a very high degree of risk involved in trading. Any information and/or content is intended entirely for research, educational and informational purposes only and does not constitute investment or consultation advice or investment strategy. The information is not tailored to the investment needs of any specific person and therefore does not involve a consideration of any of the investment objectives, financial situation or needs of any viewer that may receive it. Kindly also note that past performance is not a reliable indicator of future results. Actual results may differ materially from those anticipated in forward-looking or past performance statements. We assume no liability as to the accuracy or completeness of any of the information and/or content provided herein and the Company cannot be held responsible for any omission, mistake nor for any loss or damage including without limitation to any loss of profit which may arise from reliance on any information supplied by Everest Fortune Group.

Technical Weekly AnalysisStart your week by identifying the key price levels and trends.
The SpreadEx Research team has analysed the most popular markets, including stocks, indices, commodities & forex.
--------------------------------------------------------------------------------------------------------------
Analysis
Germany 40 remains in a bullish trend and is currently in an impulsive phase, trading at 24,202, slightly above its VWAP of 24,031. The RSI at 61.1 suggests steady buying interest. Support is at 23,641, with resistance at 24,422.
UK 100 continues in a bullish trend, trading at 8,833, above its VWAP of 8,760, indicating underlying strength. The RSI at 63.9 supports ongoing momentum. Support is at 8,679, with resistance at 8,850.
Wall Street remains in a bullish trend and is currently in an impulsive phase, trading at 42,806, above its VWAP of 42,235. The RSI of 61.8 indicates sustained buying strength. Support is at 41,513, with resistance at 42,857.
Brent Crude is in a neutral consolidation phase, trading at 6,628, slightly above its VWAP of 6,464, indicating tight price action. The RSI at 58.4 suggests a balanced market outlook. Support is at 6,268, with resistance at 6,640.
Gold remains in a neutral consolidation phase, trading at 3,320, marginally above its VWAP of 3,310, indicating cautious market interest. The RSI at 51.4 points to a neutral stance. Support is at 3,231, with resistance at 3,396.
EUR/USD is in a bullish trend but in a consolidation phase, trading at 1.1434, slightly above its VWAP of 1.1347. The RSI at 58.5 indicates steady buying interest. Support is at 1.1208, with resistance at 1.1486.
GBP/USD is in a bullish impulsive phase, trading at 1.3573, above its VWAP of 1.3481, confirming ongoing strength. The RSI at 62.3 shows solid bullish momentum. Support is at 1.3328, with resistance at 1.3636.
USD/JPY is currently in a neutral consolidation phase, trading at 144.04, matching its VWAP of 144.00. The RSI at 49.3 points to a neutral tone. Support is at 142.24, with resistance at 145.61.

New Week New Trades with Pinex CaptialWe have built a strong zone on the Dax where we can expect a reaction downwards if we pay attention to the current topics in the world and we still have the cap that we would like to fill I think this week is the right time for it we are getting weaker and weaker at the ATH so if you want to long watch your money ^^ Cheers

Drop followed by riseDax is currently ranging and may drop towards the 24,000 due to failing to settle above 24,300 and continue upwards. If price action manages to go beyond 24,3k zone, the indice will probably be bullish until the bulls run out of steam. If price remains under the 24,300 zone, a bearish lens is favourable.

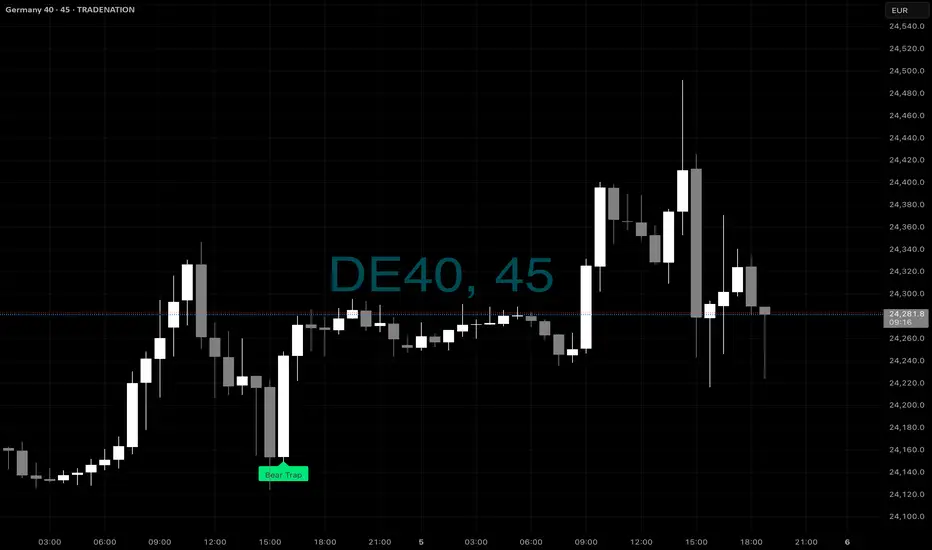
2 TRAPS - 2H chartHere you can see - looked for sells after bull traps.
Then look for buys after bear traps….
Hope you can see the potential - and if you use this indicator in conjunction with the other one we have fo ryou guys that confirm buy and sell entries as per previous examples.
You should have no excuse in doing well.

Longs - after TRAPHere is the last example for the week….
You can see that you can go on any timeframe to find potential bias for what moves can be up next.
Here on 45min chart we had b bear trap warning…. Meaning after this we need to find BUY trades only.
And look what move came from that….
DE40 – Buy the Dip Near Support & EMA ConfluenceTrade Idea
Type: Buy Limit
Entry: 24,171
Target: 24,555
Stop Loss: 24,039
Duration: Intraday
Expires: 06/06/2025 07:00
Technical Overview
Intraday dips continue to attract buyers, reinforcing the strength of the ongoing uptrend.
Price action is consolidating near all-time highs, with former resistance at 24,170 now acting as support.
The 20-period 4H EMA sits at 24,162, reinforcing this level as a dynamic support zone.
With no technical signs of exhaustion, the strategy is to buy into weakness, aiming for a breakout continuation toward 24,555.
Disclosure: I am part of Trade Nation's Influencer program and receive a monthly fee for using their TradingView charts in my analysis.

DAXINTRADAY bullish breakout supported at 23680Trend Overview:
The DAX Index remains in a bullish trend, supported by a series of higher highs and higher lows. The broader structure continues to favor the upside, although recent intraday price action suggests a sideways consolidation, signaling a potential pause within the prevailing uptrend.
Key Support and Resistance Levels:
Support: 23680 (key pivot), followed by 23445 and 23200
Resistance: 24570 (initial), then 24770 and 25000
Technical Outlook:
A pullback toward the 23680 support—which aligns with the prior consolidation zone—could offer a buying opportunity if price action confirms a bullish reversal from that level.
A sustained break above 24570 would likely accelerate bullish momentum, targeting 24770 and 25000 over the medium term.
Conversely, a daily close below 23680 would invalidate the bullish bias, exposing the index to a deeper retracement toward 23445 and potentially 23200.
Conclusion:
While the broader DAX trend remains bullish, traders should watch for price behavior around the 23680 level. A bounce could resume the uptrend toward 25000, but a confirmed breakdown would shift the short-term bias to bearish, signaling a deeper correction.
This communication is for informational purposes only and should not be viewed as any form of recommendation as to a particular course of action or as investment advice. It is not intended as an offer or solicitation for the purchase or sale of any financial instrument or as an official confirmation of any transaction. Opinions, estimates and assumptions expressed herein are made as of the date of this communication and are subject to change without notice. This communication has been prepared based upon information, including market prices, data and other information, believed to be reliable; however, Trade Nation does not warrant its completeness or accuracy. All market prices and market data contained in or attached to this communication are indicative and subject to change without notice.

DAX H4 | Bullish uptrend to extend higher?The DAX (GER30) is falling towards a swing-low support and could potentially bounce off this level to climb higher.
Buy entry is at 23,765.39 which is a swing-low support.
Stop loss is at 23,200.00 which is a level that lies underneath an overlap support.
Take profit is at 24,732.86 which is a resistance that aligns with the 127.2% Fibonacci extension.
High Risk Investment Warning
Trading Forex/CFDs on margin carries a high level of risk and may not be suitable for all investors. Leverage can work against you.
Stratos Markets Limited (tradu.com ):
CFDs are complex instruments and come with a high risk of losing money rapidly due to leverage. 63% of retail investor accounts lose money when trading CFDs with this provider. You should consider whether you understand how CFDs work and whether you can afford to take the high risk of losing your money.
Stratos Europe Ltd (tradu.com ):
CFDs are complex instruments and come with a high risk of losing money rapidly due to leverage. 63% of retail investor accounts lose money when trading CFDs with this provider. You should consider whether you understand how CFDs work and whether you can afford to take the high risk of losing your money.
Stratos Global LLC (tradu.com ):
Losses can exceed deposits.
Please be advised that the information presented on TradingView is provided to Tradu (‘Company’, ‘we’) by a third-party provider (‘TFA Global Pte Ltd’). Please be reminded that you are solely responsible for the trading decisions on your account. There is a very high degree of risk involved in trading. Any information and/or content is intended entirely for research, educational and informational purposes only and does not constitute investment or consultation advice or investment strategy. The information is not tailored to the investment needs of any specific person and therefore does not involve a consideration of any of the investment objectives, financial situation or needs of any viewer that may receive it. Kindly also note that past performance is not a reliable indicator of future results. Actual results may differ materially from those anticipated in forward-looking or past performance statements. We assume no liability as to the accuracy or completeness of any of the information and/or content provided herein and the Company cannot be held responsible for any omission, mistake nor for any loss or damage including without limitation to any loss of profit which may arise from reliance on any information supplied by TFA Global Pte Ltd.
The speaker(s) is neither an employee, agent nor representative of Tradu and is therefore acting independently. The opinions given are their own, constitute general market commentary, and do not constitute the opinion or advice of Tradu or any form of personal or investment advice. Tradu neither endorses nor guarantees offerings of third-party speakers, nor is Tradu responsible for the content, veracity or opinions of third-party speakers, presenters or participants.

DAX: Bulls Are Winning! Long!
My dear friends,
Today we will analyse DAX together☺️
The price is near a wide key level
and the pair is approaching a significant decision level of 24,262.29 Therefore, a strong bullish reaction here could determine the next move up.We will watch for a confirmation candle, and then target the next key level of 24,423.36.Recommend Stop-loss is beyond the current level.
❤️Sending you lots of Love and Hugs❤️

GER40 Trading Plan: Ride the Wave or Get Trapped?🚨 DE40 Heist Alert: The Bullish Breakout Robbery Plan (Swing & Scalp Strategy) 🚨
🌟 Hi! Hola! Ola! Bonjour! Hallo! Marhaba! 🌟
Attention Money Makers & Market Robbers! 🤑💰💸
Based on the 🔥Thief Trading Style🔥, here’s our master plan to loot the DE40 / GER40 "Germany40" Index. Follow the strategy on the chart—focusing on LONG entries—and escape near the high-risk Red Zone. This area is overbought, consolidating, and a potential reversal trap where bears lurk. 🏆 Take profits fast—you’ve earned it! 💪
🎯 Heist Entries:
📈 Entry 1: "The Breakout Heist!" – Wait for Resistance (24200) to break, then strike! Bullish profits await.
📈 Entry 2: "Big Players’ Pullback!" – Jump in at 23300+ for a safer steal.
🔔 Pro Tip: Set a chart alert to catch the breakout instantly!
🛑 Stop Loss Rules:
*"Yo, listen! 🗣️ If you’re entering with a buy-stop, DON’T set your SL until AFTER the breakout. Place it at the nearest swing low (4H timeframe) or wherever your risk allows—but remember, rebels risk more! 🔥"*
🏴☠️ Target: 24,800
🧲 Scalpers: Only play LONG! Use trailing SL to lock in profits. Big wallets? Go all in. Small stacks? Join the swing heist!
📊 Market Pulse:
The DE40 is neutral but primed for bullish momentum. Watch:
Fundamentals (COT, Macro, Geopolitics)
Sentiment & Intermarket Trends
Positioning & Future Targets
📌 Check our bioo linkks for deep analysis! 🔗🌍
⚠️ Trading Alert:
News = Volatility! Protect your loot:
Avoid new trades during major news
Use trailing stops to secure profits
💥 Boost This Heist!
Hit 👍 & 🔄 to strengthen our robbery crew! Let’s dominate the market daily with the Thief Trading Style. 🚀💵
Stay tuned—another heist drops soon! 🎯🐱👤

DAX INTRADAY Bullish sideways consolidation Trend Overview:
The DAX Index remains in a bullish trend, supported by a series of higher highs and higher lows. The broader structure continues to favor the upside, although recent intraday price action suggests a sideways consolidation, signaling a potential pause within the prevailing uptrend.
Key Support and Resistance Levels:
Support: 23680 (key pivot), followed by 23445 and 23200
Resistance: 24570 (initial), then 24770 and 25000
Technical Outlook:
A pullback toward the 23680 support—which aligns with the prior consolidation zone—could offer a buying opportunity if price action confirms a bullish reversal from that level.
A sustained break above 24570 would likely accelerate bullish momentum, targeting 24770 and 25000 over the medium term.
Conversely, a daily close below 23680 would invalidate the bullish bias, exposing the index to a deeper retracement toward 23445 and potentially 23200.
Conclusion:
While the broader DAX trend remains bullish, traders should watch for price behavior around the 23680 level. A bounce could resume the uptrend toward 25000, but a confirmed breakdown would shift the short-term bias to bearish, signaling a deeper correction.
This communication is for informational purposes only and should not be viewed as any form of recommendation as to a particular course of action or as investment advice. It is not intended as an offer or solicitation for the purchase or sale of any financial instrument or as an official confirmation of any transaction. Opinions, estimates and assumptions expressed herein are made as of the date of this communication and are subject to change without notice. This communication has been prepared based upon information, including market prices, data and other information, believed to be reliable; however, Trade Nation does not warrant its completeness or accuracy. All market prices and market data contained in or attached to this communication are indicative and subject to change without notice.

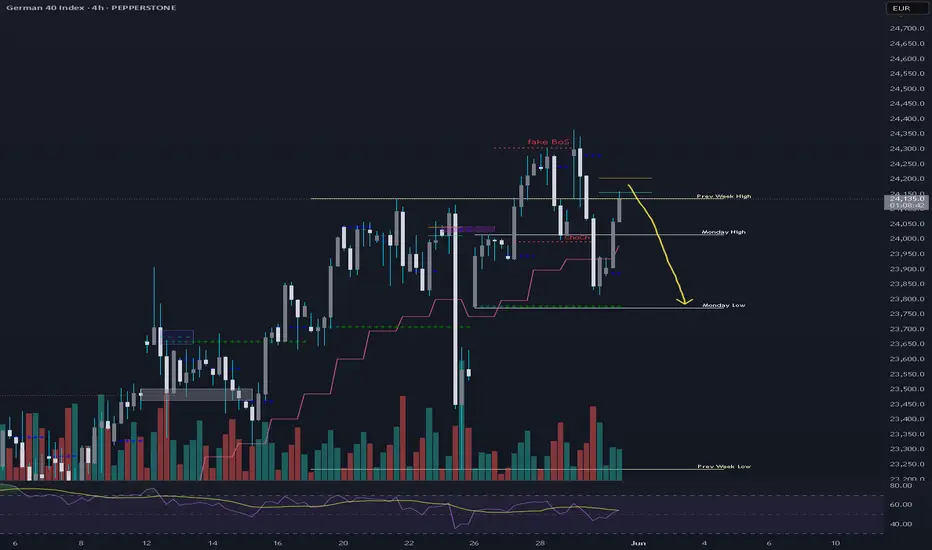
GER40GER40 has broken structure on 4h . I don't see much strenght left in it as it has entered the 4h supply zone.
Maybe NY session will sweep London highs today but after that I see it retracing back to weekly open which is also monday low as a first safe target, aiming for a long liquidation event.
Bullish continuation?DAX40 (DE40) is falling towards the pivot and could bounce to the 1st resistance.
Pivot: 23,438.30
1st Support: 22,513.00
1st Resistance: 24,749.87
Risk Warning:
Trading Forex and CFDs carries a high level of risk to your capital and you should only trade with money you can afford to lose. Trading Forex and CFDs may not be suitable for all investors, so please ensure that you fully understand the risks involved and seek independent advice if necessary.
Disclaimer:
The above opinions given constitute general market commentary, and do not constitute the opinion or advice of IC Markets or any form of personal or investment advice.
Any opinions, news, research, analyses, prices, other information, or links to third-party sites contained on this website are provided on an "as-is" basis, are intended only to be informative, is not an advice nor a recommendation, nor research, or a record of our trading prices, or an offer of, or solicitation for a transaction in any financial instrument and thus should not be treated as such. The information provided does not involve any specific investment objectives, financial situation and needs of any specific person who may receive it. Please be aware, that past performance is not a reliable indicator of future performance and/or results. Past Performance or Forward-looking scenarios based upon the reasonable beliefs of the third-party provider are not a guarantee of future performance. Actual results may differ materially from those anticipated in forward-looking or past performance statements. IC Markets makes no representation or warranty and assumes no liability as to the accuracy or completeness of the information provided, nor any loss arising from any investment based on a recommendation, forecast or any information supplied by any third-party.

DAX Channel Up targeting a 24800 Higher High.DAX (DE40) has been trading within a 1-month Channel Up and appears to be repeating the first Bullish Leg of the pattern.
More specifically, it rose by +5%, similar to April 30 - May 05 and yesterday's correction resembles May 06. With also identical 1H RSI formations (Lower Highs), we expect the uptrend to be extended in a similar structure and again target the 1.382 Fibonacci extension at 24800.
-------------------------------------------------------------------------------
** Please LIKE 👍, FOLLOW ✅, SHARE 🙌 and COMMENT ✍ if you enjoy this idea! Also share your ideas and charts in the comments section below! This is best way to keep it relevant, support us, keep the content here free and allow the idea to reach as many people as possible. **
-------------------------------------------------------------------------------
Disclosure: I am part of Trade Nation's Influencer program and receive a monthly fee for using their TradingView charts in my analysis.
💸💸💸💸💸💸
👇 👇 👇 👇 👇 👇

Idea of the Night Hey here again the result of the idea from the night is running as expected so congratulations to everyone who has seen the retest and could now take a nice long without drawdown
Stay Calm

Unreal gap with Pinex Capitalwe have started to fill the fake gap and could expect a direct reaction here and a small retest on the zone as everything speaks for it See Trump but remain cautious the market is currently very scared because nobody knows what will happen next

DAX short trade idea (4 hours chart)If we assume that the movement between May 23 and May 25 was abnormal and manipulated and remove it from the equation, we can observe a very well-defined ascending channel that is close to being broken. The next relevant support is the previous highs around the 23,475 area.
Trade idea:
Short: 24000
Stop-Loss: 24450
Take-Profit: 23475
RR: 1.17 / 1

DAX INTRADAY sideways consolidation breakoutTrend Overview:
The DAX Index remains in a bullish trend, supported by a series of higher highs and higher lows. The broader structure continues to favor the upside, although recent intraday price action suggests a sideways consolidation, signaling a potential pause within the prevailing uptrend.
Key Support and Resistance Levels:
Support: 23680 (key pivot), followed by 23445 and 23200
Resistance: 24570 (initial), then 24770 and 25000
Technical Outlook:
A pullback toward the 23680 support—which aligns with the prior consolidation zone—could offer a buying opportunity if price action confirms a bullish reversal from that level.
A sustained break above 24570 would likely accelerate bullish momentum, targeting 24770 and 25000 over the medium term.
Conversely, a daily close below 23680 would invalidate the bullish bias, exposing the index to a deeper retracement toward 23445 and potentially 23200.
Conclusion:
While the broader DAX trend remains bullish, traders should watch for price behavior around the 23680 level. A bounce could resume the uptrend toward 25000, but a confirmed breakdown would shift the short-term bias to bearish, signaling a deeper correction.
This communication is for informational purposes only and should not be viewed as any form of recommendation as to a particular course of action or as investment advice. It is not intended as an offer or solicitation for the purchase or sale of any financial instrument or as an official confirmation of any transaction. Opinions, estimates and assumptions expressed herein are made as of the date of this communication and are subject to change without notice. This communication has been prepared based upon information, including market prices, data and other information, believed to be reliable; however, Trade Nation does not warrant its completeness or accuracy. All market prices and market data contained in or attached to this communication are indicative and subject to change without notice.

GER40 | Pullback From High – Retesting Recent Breakout AreaPrice recently printed a new high at 24,336.23 and is now pulling back. It's currently hovering around the 24,104.39 zone — a minor price shelf that formed before the final push upward. This level is being retested and may act as a pivot for the next move.
Support at: 24,104.39 🔽 | 23,900.00 🔽
Resistance at: 24,336.23 🔼
🔎 Bias:
🔼 Bullish: If price holds above 24,104.39 and shows bullish candles, a move back toward 24,336.23 could follow. A breakout beyond that high would signal continuation.
🔽 Bearish: A drop below 24,104.39 — especially with momentum — could push price back to the 23,900.00 level, and potentially deeper.
📛 Disclaimer: This is not financial advice. Trade at your own risk.

DAX Bearish RSI And FIB protection zone Topping The DAX chart is been updated and seems to have entered another fib projection zone But now we see a RSI bearish divergence . .The fact we made New all time highs as the world has rallied back to .786 .618 and some to 50 % is rather negative for world markets as a group . I am entering the spirals cycle turns once again from 5/17 to june 9 th plus on minus 2.2 days I have moved to a high level short .

DAX: Will Go Down! Short!
My dear friends,
Today we will analyse DAX together☺️
The market is at an inflection zone and price has now reached an area around 24,143.24 where previous reversals or breakouts have occurred.And a price reaction that we are seeing on multiple timeframes here could signal the next move down so we can enter on confirmation, and target the next key level of 24,064.02.Stop-loss is recommended beyond the inflection zone.
❤️Sending you lots of Love and Hugs❤️
