$DXYThe U.S. dollar might face downward pressure as capital shifts into safer or high-demand assets:
💰 Stocks – High quality U.S. products still attract global demand.
🪙 Bitcoin – Emerging as digital reserves.
🥇 Gold – Classic portfolio leverage in times of uncertainty.
🇺🇸 U.S. Strategy – Dollar devaluation could be a smart move to attract foreign capital. Big market = big opportunity.
👉 The U.S. needs capital to grow. A weaker dollar might be the setup.
#Forex #DXY #Bitcoin #Gold #USMarkets #SmartMoneyMoves #TheMoneyAssociation
DOLLARINDEX trade ideas

USD Bears Take Over After 102 ResistanceTiming moves can be difficult on both long and short-term basis. But when price goes oversold on the weekly chart, it can be really difficult to chase the move lower, such as we saw in DXY back in late-April.
The currency hit a major spot of confluent support on Easter Monday and at that point RSI on the weekly was in oversold territory for only the second time in the past seven years.
As I had highlighted in this post () it was the 102 level that I wanted to see DXY trade through to illustrate bullish control following that oversold reading.
It took a few weeks, but last Monday saw an open door for bulls to make the statement move - but they fell 2 pips shy of the big figure and since then, sellers have taken more and more control of the matter.
This is where the proverbial plot thickens as there's now no oversold reading on the weekly DXY chart, and sellers have an open door to push for a major low.
On that front, we will likely need to see a breach of the 140.00 level in USD/JPY to allow for a push to a fresh low, and given the momentum in both USD and USD/JPY from the past week, that's not something that I would want to discount.
But next week is the final week of May trade and it's a big week for both markets. USD/CAD remains of attraction for USD bears given the longer-term range that remains in play there. - js

DXY Aiming for Lower LowsHi,
DXY is bearish on the 1-hour chart, headed toward the 98.901 area, potentially aiming for 97.912 with an extended drop to 96.114.
Price volatility is moving in line with price momentum across both lower and higher timeframes, suggesting strong bearish sentiment at this time.
If the price reverses and breaks above 101.000, the setup will be invalidated.
Happy trading,
K.
Not trading advice


Bond Market Breakdown: Why Yields Are Surging and What It Means 🚨 Market Recap – May 2025 Edition
This week, markets sent a clear message: rising yields are shaking the foundation. In this video, I break down the key events driving the spike in U.S.
Treasury yields — the highest in nearly two decades — and what that means for major assets like:
💵 DXY (U.S. Dollar)
📉 XAU/USD (Gold)
🟠 BTC/USD (Bitcoin)
We unpack:
Why the dollar is showing strength despite long-term fiscal concerns
How bond market stress is impacting investor sentiment across all asset classes
What rising yields mean for your portfolio — in plain language
Why this might be the most important macro signal traders are missing right now
If you’re a trader, investor, or just trying to understand what’s really moving the markets, this recap connects the dots.
📊 Watch now to stay ahead.
🔁 Feel free to share or comment with your thoughts!
#MarketRecap #BondYields #DXY #Gold #Bitcoin #MacroAnalysis #TradingView #InvestorInsights #FX #Crypto #TradingStrategy

Dollar is turning into trash and people are rushing to buy EURODXY chart shows the US dollar is crashing down. From the peak beginning of this year to current price level, it has fallen nearly 10% already. I expect more to come and would be placing strategic bets on EURUSD.

correctionIt is expected that a trend change will take place within the current support range and we will witness the start of an upward trend. Otherwise, the downward trend will continue to the next support levels.

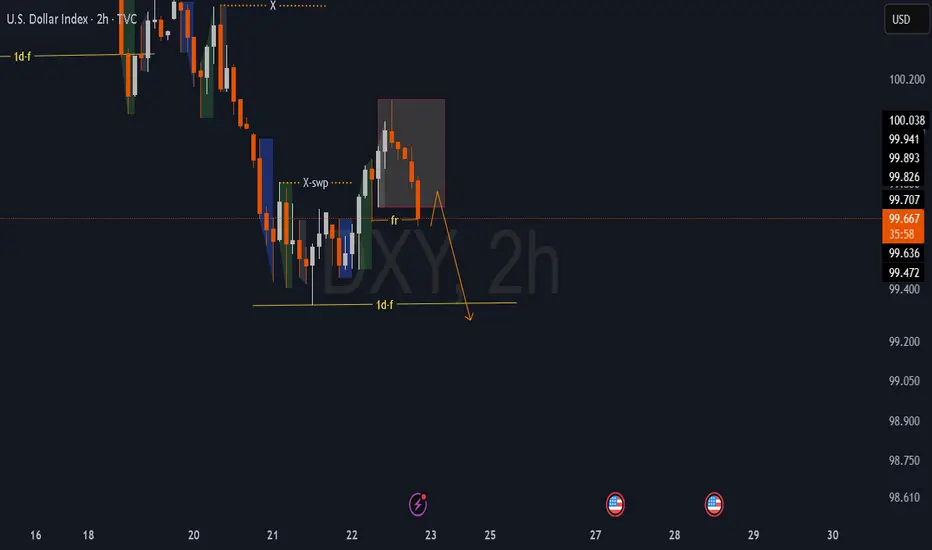
DXYDXY in 1d fractals is bearish .It's overall swing is also very bearish but currently in retracement phase . Now in 2h it gave choch after swapping liquidity . so high chance to go down from marked supply zone . once confirmed choch in 30 min as well from supply then.
all xxx / usd pairs long .
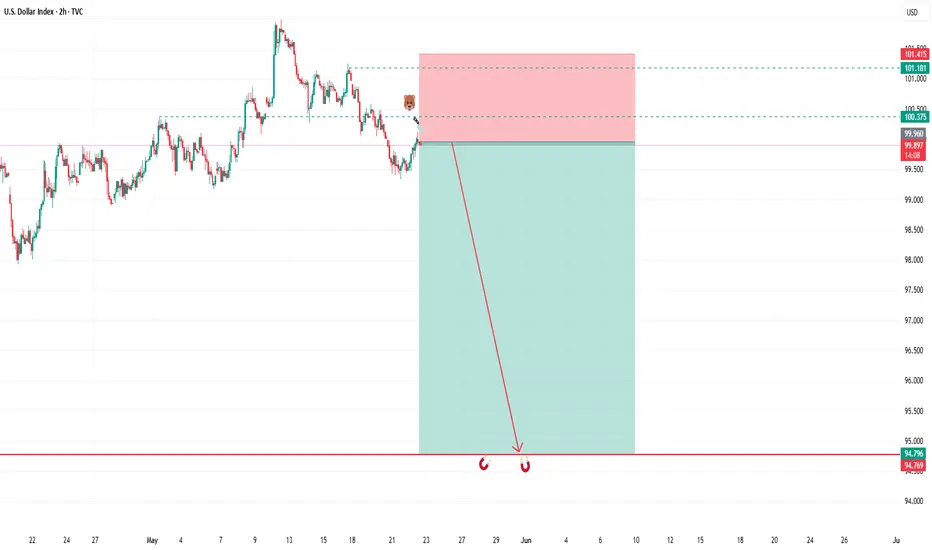
SELL THE US DOLLARThis is a continuation of our previous analysis on DXY. As we had mentioned USD DOLLAR will drop all the way to 94.800 before we consider any bullish market movement. In the next session we will be monitoring DXY for selling positions (this means buying EURUSD, GBPUSD and GOLD). Keep your risk manageable and use proper risk management. Cheers to you all.
Dollar Poised for Further Losses as Confidence Erodes – Key LeveThe U.S. dollar is under mounting pressure, with a combination of fundamental and technical factors pointing toward deeper weakness. Investor trust in the U.S. economy is waning, evidenced by a wave of insider selling from top U.S. CEOs. Their net reduction in equity holdings signals caution at the highest levels.
The U.S. bond market is also flashing warning signs. Rising debt issuance, high interest costs, and concerns over long-term fiscal discipline are pushing risk premiums higher—not as a vote of confidence, but as a red flag. These pressures reduce the dollar’s attractiveness, especially with global alternatives gaining traction.
Geopolitically, renewed tariff discussions—particularly against China—raise concerns over trade frictions and global growth, adding to bearish sentiment.
On the technical side, the break below the 100.50 level on the dollar index (DXY) has confirmed downside momentum. The monthly chart signals a bearish structure, with lower highs and lower lows forming. If selling continues, the next major target lies near the 90.00 zone—a level last seen in early 2021.

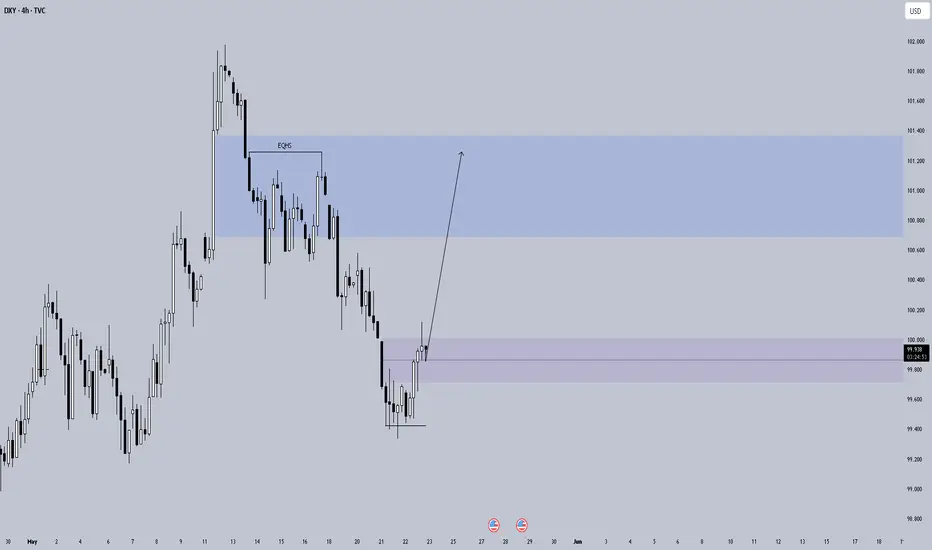
DXY 4hAfter hitting weekly FRESH demand on the DXY weeks ago, i see clear draw on liquidity on the 4h timeframe, respecting the inversed FVG, going for the EQHS
USD Reversal From 2025 Downtrend- DXY Short-term LevelsThe US Dollar Index rallied more than 4% off confluent support with the recovery failing at the yearly downtrend this month. The decline is responding to initial support late in the week with the near-term recovery may be vulnerable as we head into the close of the month.
A look at DXY price actions shows the index rebounding off support today at 99.40/47- a region defined by the 61.8% retracement of the April rally and the May low-day close (LDC).
Initial resistance is eyed at the 38.2% retracement of the recent decline / 2024 low-close at 100.35 with key resistance around the 50% retracement at 100.65- note that the April trendline converges on this threshold over the next few days. Ultimately, a breach above the Friday close / 61.8% retracement at 100.97 is needed to suggest a more significant low was registered last month / validate a breakout of the yearly downtrend.
A break below the weekly lows would threaten resumption of the broader downtrend towards subsequent objectives seen at the 78.6% retracement at 98.79 and key support at 97.71-98.39- a region defined by the 2018 swing high, the 2025 swing low, and the 61.8% retracement of the 2018 advance. Look for a larger reaction there IF reached.
Bottom line: The U.S. Dollar has broken below a multi-week uptrend with the bulls now attempting to mark resumption of the yearly downtrend. From a trading standpoint, rallies would need to be limited to 100.65 IF the index is heading lower on this stretch with a close below 99.40 needed to fuel the next leg of the decline.
Keep in mind we get the release of key U.S. inflation data next week with core personal consumption expenditures (PCE) on tap into the close of the month. Stay nimble into the release and watch the weekly closes here for guidance.
-MB

DXY Local Short! Sell!
Hello,Traders!
DXY is making a bullish
Rebound but a horizontal
Resistance is ahead at 100.300
Level so after the retest a
Local bearish correction
Is to be expected
Sell!
Comment and subscribe to help us grow!
Check out other forecasts below too!
Disclosure: I am part of Trade Nation's Influencer program and receive a monthly fee for using their TradingView charts in my analysis.


DXY: The Market Is Looking Down! Short!
My dear friends,
Today we will analyse DXY together☺️
The in-trend continuation seems likely as the current long-term trend appears to be strong, and price is holding below a key level of 99.468 So a bearish continuation seems plausible, targeting the next low. We should enter on confirmation, and place a stop-loss beyond the recent swing level.
❤️Sending you lots of Love and Hugs❤️

DXY_ DATE 22.05.2025DXY_ DATE 22.05.2025
Index starts from lower to higher
Let see US Dollar change character by next week
Cheer

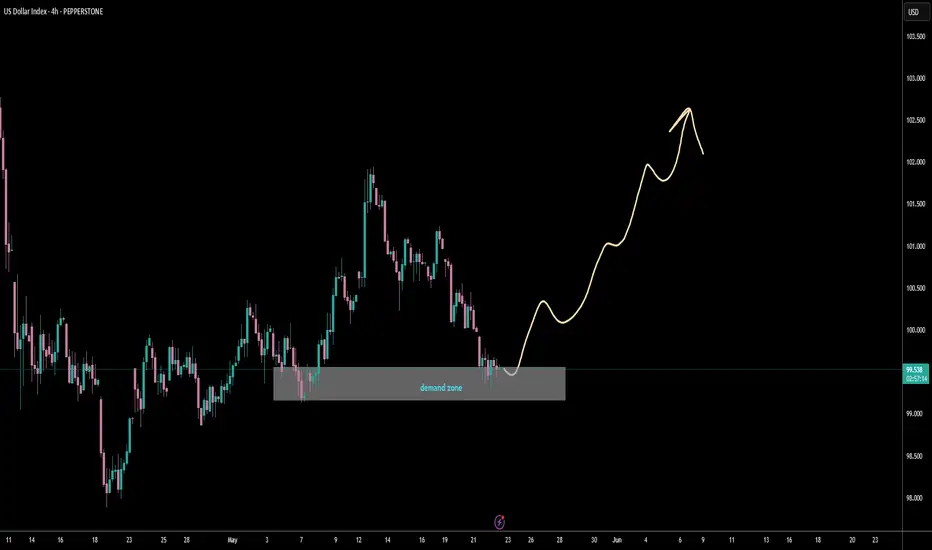
Bullish DXY after Bearish MomentumDXY Expected to Turn Bullish
There was a fakeout observed on the 1-hour timeframe, indicating a potential higher low (HL) formation and a possible breakout to the upside.
DXY Bullish Bias:
Consider buying USDXXX pairs or selling XXXUSD and Gold.

DXY Is Going Up! Buy!
Here is our detailed technical review for DXY.
Time Frame: 9h
Current Trend: Bullish
Sentiment: Oversold (based on 7-period RSI)
Forecast: Bullish
The market is trading around a solid horizontal structure 99.729.
The above observations make me that the market will inevitably achieve 100.749 level.
P.S
Overbought describes a period of time where there has been a significant and consistent upward move in price over a period of time without much pullback.
Disclosure: I am part of Trade Nation's Influencer program and receive a monthly fee for using their TradingView charts in my analysis.
Like and subscribe and comment my ideas if you enjoy them!

Crucial levels for DXY (USD Basket), Risk Trigger On/OffCrucial levels for DXY. If it breaks lower than the lower trendline it tells me that assets like BTC, Gold, Silver, Copper, Palladium and Platinum can shoot to new ATH´s. If the level holds then I think we could hit a correction in the risk assets among assets already mentioned.
TVC:DXY COMEX:HG1! OANDA:XCUUSD OANDA:XAUUSD FX_IDC:XAUUSD ICEUS:DXY FX_IDC:XAGUSD TVC:PLATINUM TVC:PALLADIUM

DXY Bullish move| 🔹 Pair / TF | DXY, 1 h → Lower Timeframes |
| 🔹 Bias | Bullish (buying potential support) |
📊 Key Levels
Level: ~99.117 (orange shaded zone)
Role: Recent Swing Low / Potential Support Zone
Level: ~98.744
Role: Lower boundary of the potential support zone
Level: ~99.727
Role: Potential Resistance (previous swing high)
Level: ~100.116
Role: Higher Potential Resistance
🚨 Trigger
Price has recently touched the ~99.117 - ~98.744 orange shaded zone, which appears to be acting as a potential support area.
There are signs of potential rejection from this zone, indicated by the recent upward price action.
Look for bullish confirmation signals on lower timeframes within this zone.
✅ Confirmation
Observe lower timeframes (e.g., 15m, 5m) for bullish reversal patterns such as double bottoms, bullish engulfing candles, or pin bars forming within the support zone.
The volume indicator at the bottom shows increasing buying volume within the support zone, suggesting potential accumulation.
Look for the Stochastic or RSI on lower timeframes to show oversold conditions followed by a bullish crossover or break above a downward trendline.
No significant bearish momentum or strong selling volume evident as price tests the support zone.
🎯 Entry & Stops
| 🔶 Entry Zone | ~99.117 – ~98.800 (within the potential support zone) |
| 🔴 Stop-Loss | Below the lower boundary of the support zone, potentially around ~98.600 - ~98.500 to allow for some buffer |
Place a Buy Limit or Buy Stop order within the entry zone, depending on your preferred entry style and confirmation.
Risk: Determine your position size based on your risk tolerance and the calculated stop-loss in pips.
🎯 Profit Targets
| Target | Level | Pips (approximate) | RRR |
| :----- | :--------- | :----------------- | :--------- |
| T1 | ~99.727 | ~60-70 | 1 : 1 or better |
| T2 | ~100.116 | ~100-120 | 1 : 1.5 or better |
Scale out:
Consider taking partial profits at T1.
Let the remaining position run towards T2, potentially adjusting your stop-loss to breakeven or in profit.
⚙️ Trade Management
Once the trade is in profit (e.g., reaching a certain pip gain or T1), consider moving your stop-loss to breakeven to protect your capital.
Monitor price action around T1. If there are strong signs of selling pressure, consider closing the remaining position.
Pay attention to any potential resistance levels or significant selling volume as price approaches your target levels.
🔑 Rationale
Price is testing a recent swing low area, which has the potential to act as support.
Increasing buying volume within the support zone suggests that buyers are stepping in.
Bullish reversal patterns on lower timeframes would confirm the rejection of the support zone.
Aiming for the previous swing high (~99.727) and the higher potential resistance (~100.116) provides logical profit targets.
⚡ Highlight:
This is a bank-order-flow style fade, looking to buy at a potential support zone after a recent pullback, anticipating a reversal and continuation of potential upward momentum. The increasing buying volume within the support zone is a key observation.

USDX retesting demand ZONEcan dollar strength return around here over next little while?!
TDA
D1 W1 DEMAND ZONE of interest
price structure building upside move by confluenced levels of lTF's
can price shake the tree to downside sure and go lower deeper into w1 demand yes times frame dependent of this set up
- to play out is a few weeks for completion.

Weekly FOREX Forecast: USD, EUR, GBP, AUD, NZD, CAD, CHF, JPYThis is the FOREX Currency futures outlook for the week of May 18 - 24th.
In this video, we will analyze the following FX Majors markets:
USD Index
EUR
GBP
AUD
NZD
CAD
CHF
JPY
USD Index has been bullish for 4 weeks. Will it continue? Expect a pullback before bullish continuation.
Selling the commodity currencies (AUD, CAD, NZD) may be the best course of action this week. Buying the EUR, GBP and CHF may also be worthwhile.
Enjoy!
May profits be upon you.
Leave any questions or comments in the comment section.
I appreciate any feedback from my viewers!
Like and/or subscribe if you want more accurate analysis.
Thank you so much!
Disclaimer:
I do not provide personal investment advice and I am not a qualified licensed investment advisor.
All information found here, including any ideas, opinions, views, predictions, forecasts, commentaries, suggestions, expressed or implied herein, are for informational, entertainment or educational purposes only and should not be construed as personal investment advice. While the information provided is believed to be accurate, it may include errors or inaccuracies.
I will not and cannot be held liable for any actions you take as a result of anything you read here.
Conduct your own due diligence, or consult a licensed financial advisor or broker before making any and all investment decisions. Any investments, trades, speculations, or decisions made on the basis of any information found on this channel, expressed or implied herein, are committed at your own risk, financial or otherwise.
