US Dollar Index (DXY) – 4H Chart AnalysisUS Dollar Index (DXY) – 4H Chart Analysis
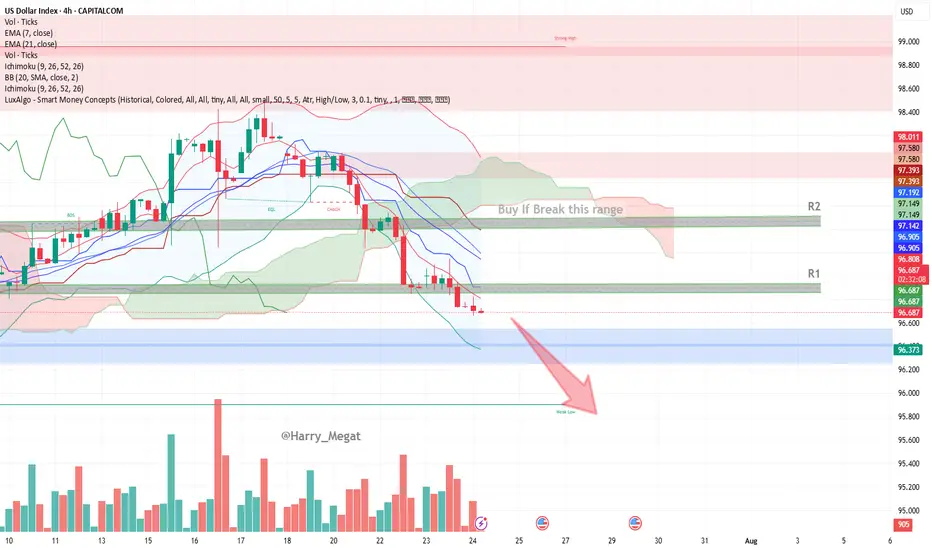
**Current Trend:** Bearish
Price trades below EMAs, Ichimoku Cloud, and within a bearish channel.
#**Bearish Scenario (Favorable)**
* **Conditions:**
* Price remains below EMA 7 & 21
* Stays under Ichimoku Cloud and 96.812 resistance (R1)
* Lower lows forming, bearish momentum increasing
* **Confirmation:**
Break below **96.37 (blue zone)**
* **Target:**
* TP1: 96.00
* TP2: 95.60 (next weak support)
**Bullish Scenario (Reversal)**
* **Conditions:**
* Price must break above **96.81 (EMA 7 + resistance)**
* Break above **R1 → 96.90**, and then above **R2 → 97.14–97.19**
* Bullish candles close above the Ichimoku cloud
* **Confirmation:**
Break and retest of **97.20**
* **Target:**
* TP1: 97.39
* TP2: 97.58 (key structure)
* TP3: 98.00 (major resistance)
**Bias:** Bearish unless DXY breaks above **97.20** with strong volume and bullish structure.
DOLLARINDEX trade ideas
DXY Chart Outlook: Trend, Support, and Price Objectives**DXY Chart Outlook: Trend, Support, and Price Objectives (Reworded Analysis)**
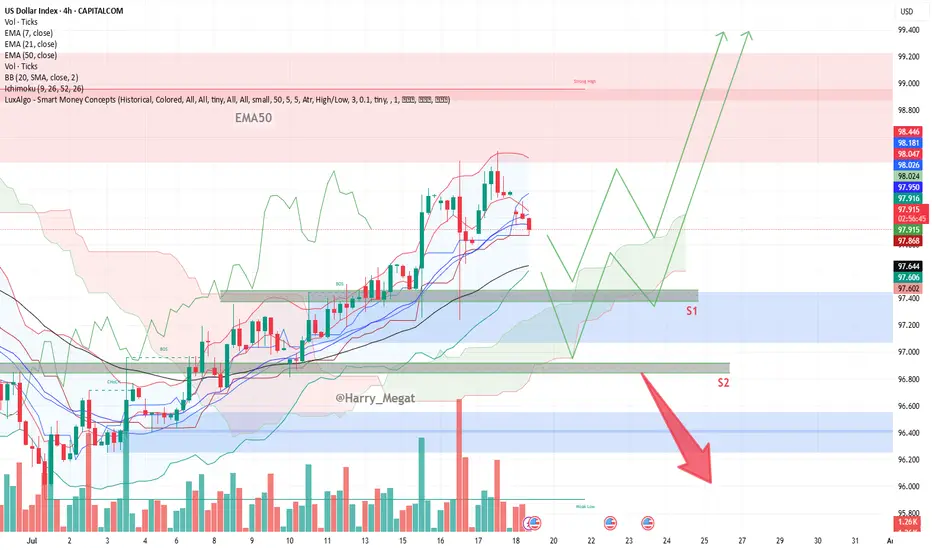
**Trend Overview**
* The DXY chart reflects a **clear upward trajectory**, characterized by a sequence of **ascending highs and higher lows** — a classic sign of bullish momentum.
* Currently, the price is **retracing toward the 50-day EMA**, which appears to be holding as **dynamic support**.
* Two important **horizontal support zones** are marked:
* **Support 1 (S1):** \~97.400 (aligned with EMA-50)
* **Support 2 (S2):** \~96.800 (a deeper correction level)
**Projected Price Zones**
* **Near-Term Objective:** **98.800 to 99.000**
* A rebound from the EMA or S1 could send price higher toward this zone, continuing the current bullish structure.
* **Mid-Term Target:** **99.200 to 99.400**
* If the price successfully clears the 99.000 resistance, further bullish continuation could aim for this intermediate target range.
* **Extended Target:** **100.000+**
* A sustained breakout beyond 99.400 could open the path toward **psychological resistance at 100.000**, possibly higher on strong momentum.
**Support Zones to Watch**
* **S1 (97.400):** This level coincides with the 50-day EMA and represents a **first line of defense**.
* **S2 (96.800):** Should the price fall below S1, this secondary level could provide **stronger support** and potential bounce opportunity.
**Risk Management**
* Consider placing a **protective stop** just below S2 — around **96.500** — to safeguard against a potential trend reversal or deeper correction.
**Summary**
* The DXY remains **technically bullish**, with potential upside targets at **98.800**, **99.400**, and eventually **100.000+**.
* Traders can monitor **S1 and S2** for potential entries or trend confirmation.
* A **breakdown below 96.500** would invalidate the bullish setup and warrant caution.
DXY FOMC FORECASTCristal Clear structure to me, dolar down today before FOMC and then up wild
Levels highlighted
Najors Gold and Cryptos will follow the same behavior
GG
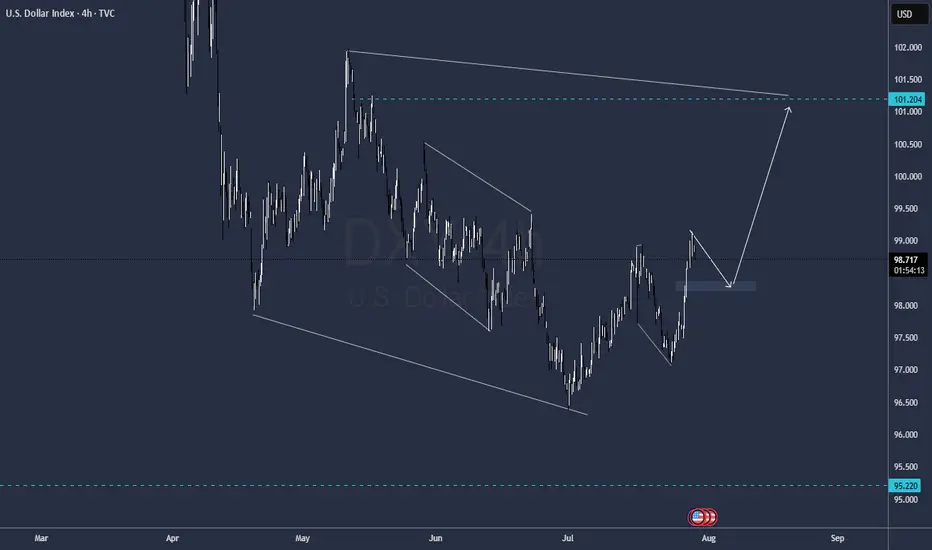
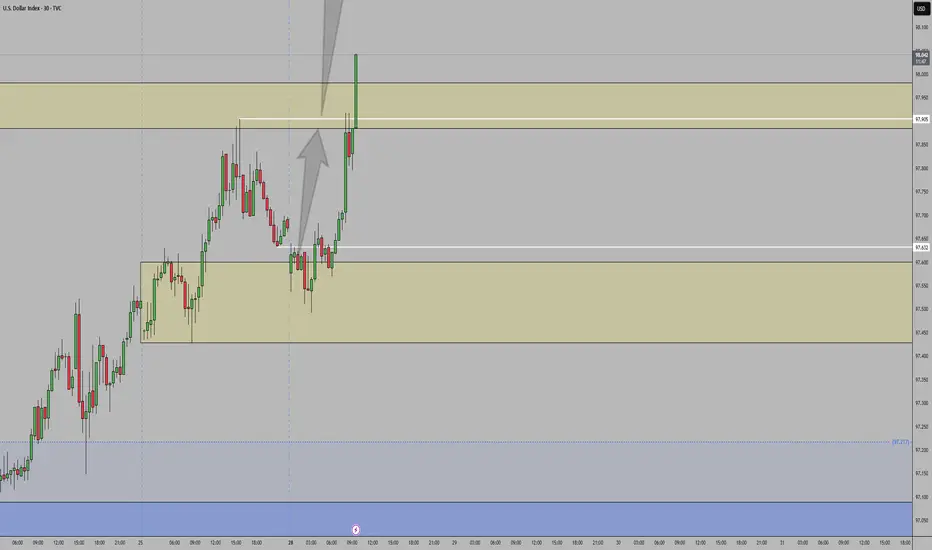
DXY (US Dollar Index)After breaking out of the downtrend and successfully testing the previous resistance level following the breakout from the Falling Wedge, the US Dollar Index looks poised for upward movement. This could temporarily slow down crypto due to dollar strength. 💵
July was nice, but August has historically been the worst month of the year — and we need to be prepared for that.

USDX at a crucial price point, which will decide trendThe next few candles for USDX price will be extremely important to understand where the dollar index is headed.
Based on that, we'll be able to choose 'which' Forex pairs we can trade, and more importantly 'how' we can trade them.
If price starts to follow the green line, and takes out 99.000, we'll be in an uptrend.
If price goes back to the red line and eventually goes below 96.400, we'll be in a downtrend.
Hopefully price won't consolidate too much, and trend in a particular direction.
DXY Buyers Catching BidSee chart for analysis but even with price sitting inside levels of supply, we could easily see stronger Fundamentals coming out to drive this dollar back up into 100.5 areas of monthly supply. Short-term I remain bullish with long term views to the downside.

DOLLAR INDEX U.S. Dollar Index (DXY) and US 10-Year Treasury Yield
Dollar Index (DXY) — will reclaim 103-102 level if it crosses 100 mark currently is at 98.34 and faces immediate supply roof ,a make or break situation awaits dollar buyers .
Over the past month, the Dollar Index has gained about 2%, although it is still down over 5% compared to a year ago. The recent uptick follows a period of volatility and selling, with investors recalibrating expectations after the resolution of trade risk premiums and recent U.S.–EU trade deals.
US 10-Year Treasury Yield keep rising after its drop from 4.193% in early july to 4.5% on 17th
Yield on the US 10-year Treasury note is currently about 4.42% , modestly higher than last week and unchanged from the previous session.
Current levels reflect ongoing uncertainty regarding future Federal Reserve policy moves, cautious optimism regarding U.S. economic strength, and some abatement of safe-haven flows after recent global trade developments.
Relationship & Market Synopsis
DXY and the 10-year yield typically have a positive correlation: When Treasury yields rise, the dollar often follows, as higher yields make dollar-denominated assets more attractive to global investors. Conversely, falling yields can weigh on the dollar. However, in 2025, there have been periods of divergence due to external shocks and policy uncertainty.
Current setup: Both DXY and the 10Y yield are rising modestly, signaling a shift to a more constructive tone for the U.S. dollar as risk sentiment stabilizes and investors scale back some safe-haven trades. Recent U.S. economic resilience and fading tariff fears have reduced the need for defensive flows, supporting both yields and the dollar.
Forward outlook: Market consensus expects limited further upside for Treasury yields unless there are strong surprises in U.S. data or Federal Reserve communication. The DXY is projected to stabilize near current levels or drift higher on persistent U.S. economic momentum.
Summary:
Both the Dollar Index and US 10-year Treasury yield are modestly higher as of July 29, 2025. Their positive price action reflects improving US growth prospects, reduced global risk premiums, and recalibrated market expectations on Fed policy. While their relationship is generally positive, periods of divergence have occurred in 2025 due to trade, policy, and economic shocks. Currently, both are showing moderate gains as investor sentiment stabilize

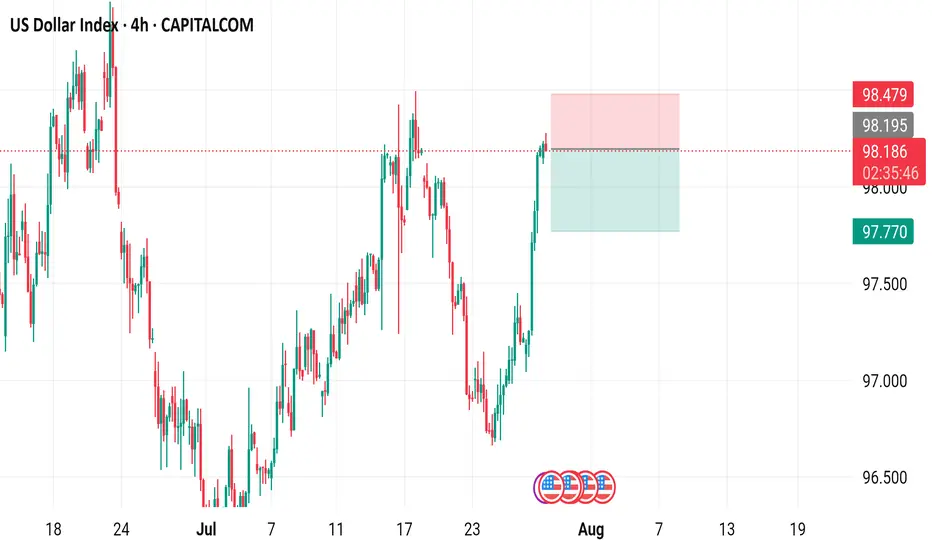
US Dollar Index (DXY) - 4 Hour Chart4-hour chart from CAPITALCOM displays the recent performance of the US Dollar Index (DXY), showing a current value of 98.190 with a slight decline of 0.009 (-0.01%). The chart highlights key price levels, including a recent sell signal at 98.189 and a buy signal at 98.243, with a resistance zone marked between 98.195 and 98.479. The index has experienced fluctuations, with notable drops and recoveries, and is currently trending near the 98.190 level as of July 29, 2025.

dxy buy tradeThe Relative Strength Index (RSI) is showing an upward trend, indicating increasing momentum. Additionally, the Moving Average Convergence Divergence (MACD) is showing a bullish crossover, further supporting the potential for an upward move

Dollar us dxyI think the US dollar will fall sharply, causing a sharp rise in gold. There will probably be a bigger fall than in 2008 in the global economy, especially in the US.

Analysis on the DXY – EURUSD RelationshipHello traders,
Here’s an analysis that can be useful for both short-term and swing trades on EURUSD and DXY. Our trading team’s calculations are as follows:
Analysis on the DXY – EURUSD Relationship
Currently, DXY is at 98.200. Historical statistical data indicate that if DXY declines toward 96.300, there is approximately a **1.55% probability of an upward move** in EURUSD.
Based on this scenario:
Current EURUSD level: 1.16500
Projected target level:1.1830
While the correlation data show a strong inverse relationship, it’s important to note that periodic deviations can occur in the market. Therefore, this analysis should be considered a statistical projection only, not a guaranteed outcome.

DXY - ABC Move still in playDXY has been moving not so much on technical factors lately but more so with what Mr. Trump says, we still could see a move lower with an ABC pattern.
Good Luck

DXYDXY Bullish COT Setup
Commercials: Net-long ~3,988 → smart money positioning for strength
Large Specs: Net-short ~3,451 → bearish bias, potential squeeze risk
COT Index: 94.5% → near historical extreme, signaling possible trend shift
DXYThe U.S. Dollar Index (DXY) continues to exhibit a bearish outlook driven by a combination of technical weakness and shifting macroeconomic fundamentals. Market expectations for Federal Reserve rate cuts, coupled with softer U.S. economic data and declining demand for the dollar as a safe-haven asset, have weighed heavily on the index. Technically, the DXY remains below key moving averages, with momentum indicators showing sustained weakness. Unless there is a significant shift in sentiment or a surprise in monetary policy direction, the bias remains to the downside over the near to medium term.
Bullish reversal?US Dollar Index (DXY) is falling towards the pivot and could bounce to the 1st resistance, which is an overlap resistance.
Pivot: 96.99
1st Support: 96.38
1st Resistance: 97.90
Risk Warning:
Trading Forex and CFDs carries a high level of risk to your capital and you should only trade with money you can afford to lose. Trading Forex and CFDs may not be suitable for all investors, so please ensure that you fully understand the risks involved and seek independent advice if necessary.
Disclaimer:
The above opinions given constitute general market commentary, and do not constitute the opinion or advice of IC Markets or any form of personal or investment advice.
Any opinions, news, research, analyses, prices, other information, or links to third-party sites contained on this website are provided on an "as-is" basis, are intended only to be informative, is not an advice nor a recommendation, nor research, or a record of our trading prices, or an offer of, or solicitation for a transaction in any financial instrument and thus should not be treated as such. The information provided does not involve any specific investment objectives, financial situation and needs of any specific person who may receive it. Please be aware, that past performance is not a reliable indicator of future performance and/or results. Past Performance or Forward-looking scenarios based upon the reasonable beliefs of the third-party provider are not a guarantee of future performance. Actual results may differ materially from those anticipated in forward-looking or past performance statements. IC Markets makes no representation or warranty and assumes no liability as to the accuracy or completeness of the information provided, nor any loss arising from any investment based on a recommendation, forecast or any information supplied by any third-party.

Is the DOLLAR bullish? Look at the weekly support zone levelsI am trying to figure out what the recent bullish days mean within the overall range.
Please let me know what you think 🙏🏾

DXYJULY 21-25 recap
Net was -296 last week
Price dropped until Wednesday
Hit the weekly demand zone (strong support)
Sellers paused or covered shorts there
Buyers stepped in → possible bounce or reversal

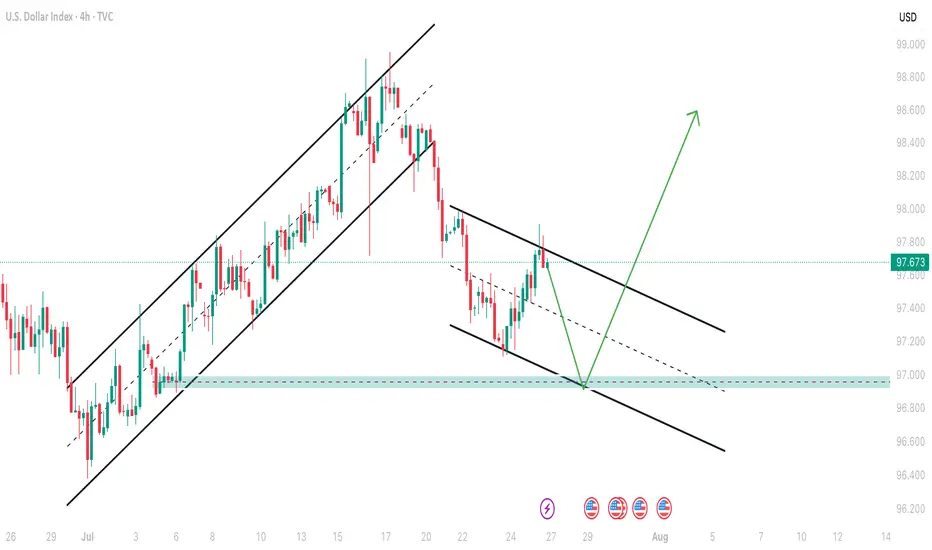
DXY index moving towards down in higher timeframeAs you can see DXY index is moving inside channel and now its time for second swing failure to go down.Then channel movement will finish and it will breakout towards upward so i recomand trade USD pairs accordingly.This is my analysis not a financial advice so trade according your risk management.
Dollar Index Dips – All Eyes on 97.600?The US Dollar Index (DXY) is currently trading just below the 100.000 🔼 resistance area, following a series of lower highs and lower lows that reflect a clear bearish trend. Price is now approaching the 97.600 🔽 level, which has previously acted as a key turning point and could influence the next directional move.
Support at: 97.600 🔽
Resistance at: 100.000 🔼, 101.500 🔼, 102.812 🔼, 104.223 🔼
🔎 Bias:
🔽 Bearish: The trend remains bearish while price stays below 100.000. A break below 97.600 may lead to further downside continuation.
🔼 Bullish: A bounce from 97.600 followed by a move back above 100.000 could open the door for a recovery toward 101.500.
📛 Disclaimer: This is not financial advice. Trade at your own risk.

DXY - BearishI am expecting more bearish on the USD. There is a possiblity it can get to 97.984 before bearish resumes.

DXY: Strong Bullish Sentiment! Long!
My dear friends,
Today we will analyse DXY together☺️
The in-trend continuation seems likely as the current long-term trend appears to be strong, and price is holding above a key level of 96.722 So a bullish continuation seems plausible, targeting the next high. We should enter on confirmation, and place a stop-loss beyond the recent swing level.
❤️Sending you lots of Love and Hugs❤️
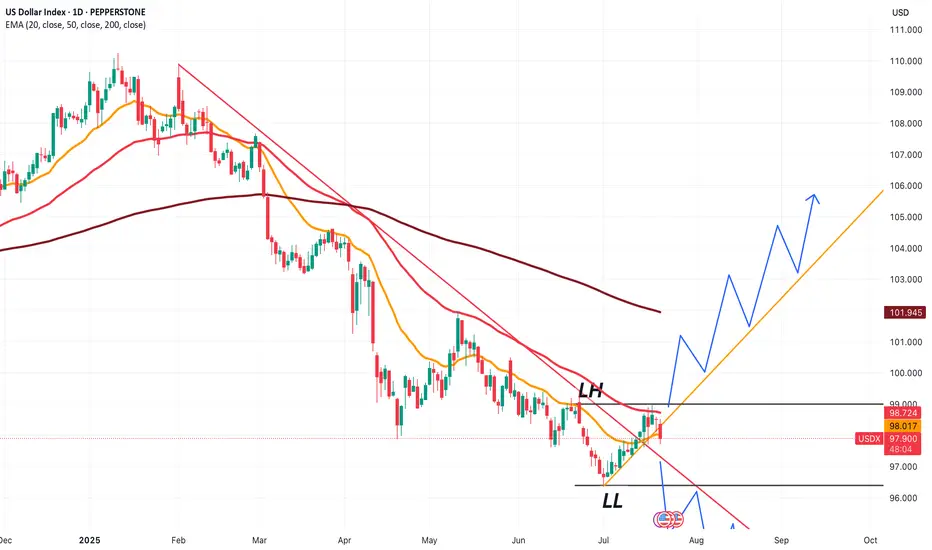
DXY 1D – Tipping Point: News or Price Action?Hey Guys,
The DXY index is currently moving within a downtrend. This trend is unlikely to reverse unless it breaks above the 98.950 level.
Sure, key fundamental data could shift the trend, but without those news catalysts, a reversal at this point doesn’t seem realistic.
Don’t forget—98.950 is a critical threshold for the DXY.
I meticulously prepare these analyses for you, and I sincerely appreciate your support through likes. Every like from you is my biggest motivation to continue sharing my analyses.
I’m truly grateful for each of you—love to all my followers💙💙💙
