GER30 Eyes New Highs with Key Support TestsHello,
FX:GER30 continues to impress, reaching new highs with a solid upward trend. We now expect support tests around the 1M PP level. So far, we've seen support at the 1D PP, but it remains to be seen if that will shift moving forward. If the price crosses and holds above 19,643.5565, the next upside target is 19,764.4548. Should it break and hold above 19,764.4548, we could see a move towards 20,127.1495.
TradeWithTheTrend3344
GERMANY40 trade ideas

GER30 D1 | Bearish breakoutBased on the daily chart analysis, we can see that the price is falling toward our sell entry at 19,424.
Our take profit will be at 19,004.35, an overlap support level.
The stop loss will be at 19,715.59,above 127.2% Fibo extension
High Risk Investment Warning
Trading Forex/CFDs on margin carries a high level of risk and may not be suitable for all investors. Leverage can work against you.
Stratos Markets Limited (www.fxcm.com):
CFDs are complex instruments and come with a high risk of losing money rapidly due to leverage. 62% of retail investor accounts lose money when trading CFDs with this provider.You should consider whether you understand how CFDs work and whether you can afford to take the high risk of losing your money.
Stratos Europe Ltd, previously FXCM EU Ltd (www.fxcm.com):
CFDs are complex instruments and come with a high risk of losing money rapidly due to leverage. 59% of retail investor accounts lose money when trading CFDs with this provider. You should consider whether you understand how CFDs work and whether you can afford to take the high risk of losing your money.
Stratos Trading Pty. Limited (www.fxcm.com):
Trading FX/CFDs carries significant risks. FXCM AU (AFSL 309763), please read the Financial Services Guide, Product Disclosure Statement, Target Market Determination and Terms of Business at www.fxcm.com
Stratos Global LLC (www.fxcm.com):
Losses can exceed deposits.
Please be advised that the information presented on TradingView is provided to FXCM (‘Company’, ‘we’) by a third-party provider (‘TFA Global Pte Ltd’). Please be reminded that you are solely responsible for the trading decisions on your account. There is a very high degree of risk involved in trading. Any information and/or content is intended entirely for research, educational and informational purposes only and does not constitute investment or consultation advice or investment strategy. The information is not tailored to the investment needs of any specific person and therefore does not involve a consideration of any of the investment objectives, financial situation or needs of any viewer that may receive it. Kindly also note that past performance is not a reliable indicator of future results. Actual results may differ materially from those anticipated in forward-looking or past performance statements. We assume no liability as to the accuracy or completeness of any of the information and/or content provided herein and the Company cannot be held responsible for any omission, mistake nor for any loss or damage including without limitation to any loss of profit which may arise from reliance on any information supplied by TFA Global Pte Ltd.
The speaker(s) is neither an employee, agent nor representative of FXCM and is therefore acting independently. The opinions given are their own, constitute general market commentary, and do not constitute the opinion or advice of FXCM or any form of personal or investment advice. FXCM neither endorses nor guarantees offerings of third party speakers, nor is FXCM responsible for the content, veracity or opinions of third-party speakers, presenters or participants.

uptrend continuation?!Price recently broke out of our Major resistance and retested it and H1 is showing bullish, meaning there's a high chance that the market will continue going up for some time

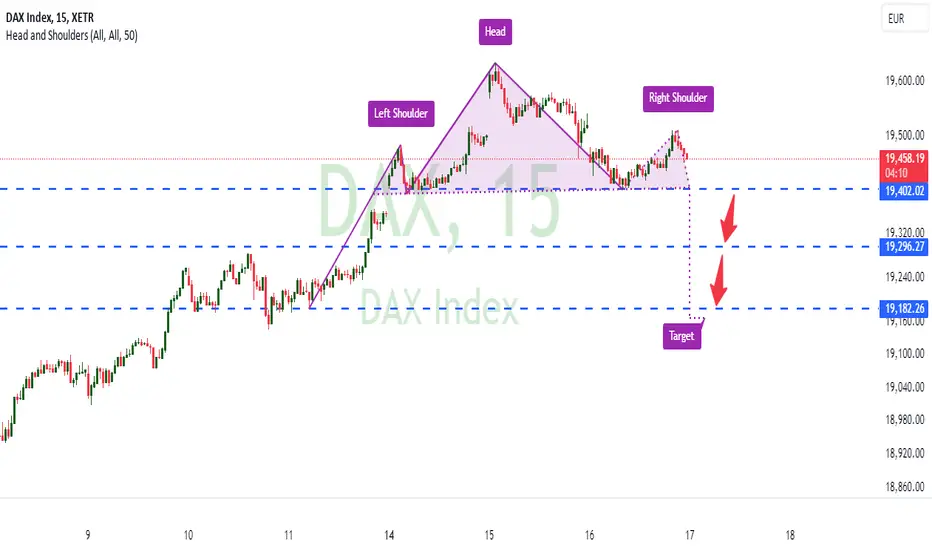
DAX SELL ANALYSIS HEAD AND SHOULDER PATTERNHere on Dax price has form head and shoulder and now try to fall so if line 19402.02 break then trader should go for SHORT with expected profit target of 19296.27 and 19182.26 . Use money management

DAX (GER40) - Correction after ATH?After reaching a new all-time high yesterday, the DAX is now in a correction phase. The Dax is currently trading at 19480 points and has already made several attempts to fall further. For me, there are two possible scenarios today:
1. the Dax can find support here and continue its secondary trend. In this case, we should see another ATH relatively quickly.
2. more likely for me: the DAX initially moves between 19400 and 19550 points and then continues its correction towards 19200 points. The trend line of the primary trend is also waiting here and offers good opportunities for a long entry.

Good Luck BullsThis kind of Pin Bar always got revisited in the last several years, I hope this time it made an exception. The chart drawing and bar merging is according to the chanlun Principle.

Weekly Technical AnalysisStart your week by identifying the key price levels and trends.
The SpreadEx Research team has analysed the most popular markets, including stocks, indices, commodities & forex.
*KEY
Trend is set by the slope of the VWAP over 50 periods
Phase is determined by the current price relative to the VWAP (20) level (above or below)
Support & Resistance are set by the StdDev #2 Lower and Upper respectively.
Momentum is determined by the RSI level (70 as overbought and under 30 as oversold).
Analysis
---------------------------------------------------------------------------------------------
Germany 40
Germany 40 remains bullish but has shifted into an impulsive phase. The price is 19,417, sitting above the VWAP (20) of 19,136. Support is now at 18,735, while resistance is positioned at 19,537. The RSI has increased to 62, signalling strong bullish momentum.
UK 100
The UK 100 continues in a neutral trend within a consolidation phase. The price is 8,245, just under the VWAP (20) of 8,269. Support is at 8,212, and resistance is at 8,326. The RSI is at 46, reflecting reduced momentum and indicating no clear directional bias.
Wall Street
Wall Street remains bullish, in an impulsive phase. The current price is 42,805, above the VWAP (20) of 42,186. Support is at 41,597, and resistance is positioned at 42,800. The RSI stands at 64, reflecting continued bullish momentum.
Brent Crude
Brent Crude remains bullish in an impulsive phase. The price is 77.12, above the VWAP (20) of 75.36. Support is located at 69.59, and resistance is at 81.13. The RSI is 53, indicating moderate bullish momentum with potential for more upside.
Gold
Gold continues to be bullish and in an impulsive phase. The current price is 2,658, above the VWAP (20) of 2,645. Support is found at 2,611, while resistance is at 2,679. The RSI is 61, showing steady bullish momentum.
EUR/USD
EUR/USD remains in a bearish trend, in an impulsive phase. The price is 1.0924, below the VWAP (20) of 1.1051. Support is at 1.0924, while resistance stands at 1.1249. The RSI is 31, signalling strong bearish momentum.
GBP/USD
GBP/USD remains bullish, though in a corrective phase. The price is 1.3052, below the VWAP (20) of 1.3220. Support is at 1.2936, and resistance is at 1.3505. The RSI is 37, reflecting slowing bullish momentum.
USD/JPY
USD/JPY remains bullish, in an impulsive phase. The current price is 149.48, well above the VWAP (20) of 146.14. Support is at 140.83, and resistance is at 151.45. The RSI stands at 65, indicating strong bullish momentum.

19830€ scenarioThe price of the DAX has got above a weekly Ichimoku forecast line so I think that it could go to 19830€ that is the price at +1.168 fibonacci level relative to a range identified in H4.

DAX to challenge the all time highs?DE30EUR - 24H EXPIRY
Our short term bias remains positive.
Intraday dips continue to attract buyers and there is no clear indication that this sequence for trading is coming to an end.
Previous resistance at 19300 now becomes support.
We look to buy dips.
Price action continues to trade around the all-time highs.
- We look to Buy at 19305 (stop at 19205)
Our profit targets will be 19555 and 19625
Resistance: 19400 / 19495 / 19600
Support: 19340 / 19300 / 19200
Risk Disclaimer
The trade ideas beyond this page are for informational purposes only and do not constitute investment advice or a solicitation to trade. This information is provided by Signal Centre, a third-party unaffiliated with OANDA, and is intended for general circulation only. OANDA does not guarantee the accuracy of this information and assumes no responsibilities for the information provided by the third party. The information does not take into account the specific investment objectives, financial situation, or particular needs of any particular person. You should take into account your specific investment objectives, financial situation, and particular needs before making a commitment to trade, including seeking advice from an independent financial adviser regarding the suitability of the investment, under a separate engagement, as you deem fit.
You accept that you assume all risks in independently viewing the contents and selecting a chosen strategy.
Where the research is distributed in Singapore to a person who is not an Accredited Investor, Expert Investor or an Institutional Investor, Oanda Asia Pacific Pte Ltd (“OAP“) accepts legal responsibility for the contents of the report to such persons only to the extent required by law. Singapore customers should contact OAP at 6579 8289 for matters arising from, or in connection with, the information/research distributed.


DAX: Europe kicks off the week robustlyEuropean stock markets started the week little changed due to the disappointing update on China's stimulus, which generated uncertainty among investors. Although the technology and telecommunications sectors showed slight gains, luxury, leisure and travel stocks, especially those linked to the Chinese market, fell significantly. French companies LVMH and Hermes experienced declines of between 1.4% and 3.6%, reflecting concerns about the lack of clarity on the size of the Chinese stimulus package.
In the European context, expectations are focused on the upcoming meeting of the European Central Bank (ECB), which could announce a further interest rate cut. This move is in response to weak economic indicators in the euro zone, which point to a slowing economy. Markets have already discounted a 99% probability of a 25 basis point cut, which could have an impact on the performance of European stock markets in the short term.
Despite the uncertainty, companies in the STOXX 600 index are expected to report earnings growth of 4.6% in the third quarter, although estimates have been declining since September. Earnings season will be key in determining the future of the European market, especially in sectors such as technology and financials, which have attracted significant capital inflows.
Meanwhile, the British betting sector was hit by the possibility of a tax hike, while luxury brand Mulberry stood out with a 16% rise following an improved takeover bid.
Overall, European investors' focus is divided between international developments, such as Chinese stimulus, and local events, such as ECB decisions and the earnings season.
On the technical side DAX (Ticker AT: GER40) has evolved through the upper part of its long-range channel bouncing in the middle zone without exceeding the 161.80% area of the previous Fibonacci retracement which coincides with the all-time high of 19,501.94. It would not be difficult to see a further climb to the highs given that RSI is at 62.34% and could extend the move until the ECB announcements. The crosses of averages and bollinger bands do not seem to give a sign of narrowing but of extension of the movement of the index. Relevant for the index this week will be German retail sales, economic sentiment and general Eurozone data on inflation that may affect German exports. The control point of the bell is located in the area of 18,500 points so it would not be unusual to see a sharp correction to the bottom of the long-term channel if the rate cuts and economic sentiment do not accompany temporarily slowing the escalation.
Ion Jauregui - ActivTrades Analyst
*******************************************************************************************
The information provided does not constitute investment research. The material has not been prepared in accordance with the legal requirements designed to promote the independence of investment research and such should be considered a marketing communication.
All information has been prepared by ActivTrades ("AT"). The information does not contain a record of AT's prices, or an offer of or solicitation for a transaction in any financial instrument. No representation or warranty is given as to the accuracy or completeness of this information.
Any material provided does not have regard to the specific investment objective and financial situation of any person who may receive it. Past performance is not reliable indicator of future performance. AT provides an execution-only service. Consequently, any person acing on the information provided does so at their own risk.

14.10.24Markets recently have been bullish, the main question is can markets continue to be bullish and will the strength on the US and Euro economy continue to strengthen after the recent rate cuts. Results from US earnings with a close eye on Netflix and retail sales are due out this week and people will look see what these results mean for the Fed officials, whist the European bank is expected to deliver a quarter point rate cut.
Us30: As we can see price has broken out of the sideways range sinc Septmeber and has now reached 42654.00 after bouncing up from 41828.59. In essence I'd like to see price continue higher for a little while longer but it is due to retrace if anything at this point.
Ger40: After bounce from an area of demand price is now pushing towards 19500.4 which it should reach some time soon possibly before Wednesday. After I will expect price to atleast retrace also.

H1 Still Green Above 200ma 1.5 Ratio Entry still Available??H1 Still Green Above 200ma 1.5 Ratio Entry still Available??
wait m15/m30 flip back to green then keep smaller TF 1.5 RR or Hold this entry 1H retesting 19500.

#202441 - priceactiontds - weekly update - daxGood Evening and I hope you are well.
tl;dr
dax: Max bullish for 19500/19600. Bulls have all the arguments if they stay above 19200. 19000-19200 is neutral and only a daily close below 19000 could start a bear case. My base assumption is that we are in W5 of this bull trend which could lead up to 20000.
dax xetra
Quote from last week:
comment: Bearish scenario played out during the week and bears managed to reach the lower bull trend line which bulls happily bought on Friday. Right now the odds heavily favor the bulls. Market has two very good reasons why the area around 18950 is support and since we are in a bull trend and got a decent signal bar on Friday, I want to be long above 19200 for 19400 or higher.
comment : Bullish outlook was good. Bulls will likely retest ath on Monday/Tuesday and have good chances of making new ones. My targets above are 19500 and 19600 with 20000 being possible if we get blow-off top. Don’t be a bear until bears can close below 18900.
current market cycle: bull trend
key levels: 19000 - 20000
bull case: Bulls have all arguments on their side again. My bullish wave thesis is still fitting perfectly and W5 could lead to 20000. Any close below 19200 would seriously hurt the bull case.
Invalidation is below 1920.
bear case: Bears need a daily close below 19200 to start making more bulls doubt this breakout above the minor trading range which was my W4. As of now bears do not have any reasonable arguments to stop this.
Invalidation is above 19400.
outlook last week:
short term: Neutral between 19000-19200, very bullish above 19200 and slightly bearish but more cautious below 19000.
→ Last Sunday we traded 19120 and now we are at 19373. Bullish outlook above 19200 was perfect and I hope you made some.
short term: Bullish for 19500 and higher.
medium-long term - Update from 2024-10-06: 3 Months left in 2024 and I do think the market is in a trading range where the upper area is around 19500 and the lower area is probably 17000 or 16000 if something bigger comes up. Since we are at the very top, I expect the market to go some sideways before trying to go down again. Not so sure about 19491 being the high, since liquidity could see a bigger increase and upside could be higher. We will likely have another 10%+ correction this year and a possible year end rally.
Update 2024-10-13: Possibility of a blow-off top to 20000 is there. If we get there, it will be the short opportunity of the decade.
current swing trade: None
chart update: Removed the ABC wave up and replaced it with a 5-wave series.

Ger 40 dax sell Possibility to go down is 70% according to me , it will go to retest that trendline, buyers look weak on 4h .
You can combine with your setup if it's sell

GER30 Continues Strong Bullish Momentum!Hello,
The FX:GER30 has been performing exceptionally well, and further upward movement is anticipated. The price has adhered closely to the established pivot points, reinforcing expectations for additional bullish momentum!
TradeWithTheTrend3344

Trendline breakWhat we have here is a correction that formed a trendline, which was followed by a breakout and today we had a pullback giving us a perfect entry at the higher high
WE ONLY TRADE PULLBACKS

DAX: Channel Up intact. Bullish.DAX is bullish on its 1D technical outlook (RSI = 61.639, MACD = 2020.300, ADX = 35.161) but only neutral on 4H, indicating the significant upside potential it has. Right now the price found support on the 4H MA50 and is rebounding. This suggests the the previous correction is over, the bearish wave of the two month Channel Up bottomed near the 4H MA200 and the 0.5 Fib. We turn buyers again on DAX, aiming for the -0.382 Fib (TP = 19,900).
## If you like our free content follow our profile to get more daily ideas. ##
## Comments and likes are greatly appreciated. ##


Wed 2024 10 09 - Long||| Stats |||
Stats Day:
** 08:00 H4 double color, - NO
** 09:00 H3 Doji other side, - NO
** 09:30 VOLD ???, AD ???, Senti +38, Agio St ???, Lg ???, - Short
** 09:45 VOLD ???, AD ???, Senti +20, Agio St ???, Lg ???, - Short
Stats Week:
** Thu US CPI: 14:30,
** Mon Morning rule - pending,
** Tue return to W1 trend and not a W1 trend change - pending,
Stats Month:
** Oct turn,
** Mid Nov end,
Stats Year:
** US Election,
||| Trade Taken |||
Trade Taken:
** Time frame:
* H3
** Time:
* 03pm,
Set-Up:
** Trigger for trade:
* Momentum Long,
* Senti +20!,
** Mom Width:
* 4 candles - strong,
* 6 candles - strong,
** Mom Type:
* 2nd directional - risk at 1st or last Mom turn,
Risk Reward:
** Risk:
* Initial Turn,
** Target:
* R 1:1 as range increased possible, and against short indicators,
* VOLD AD unavailable today,

DAX H4 | Falling to 50% Fibonacci SupportDAX (GER30) is falling towards a pullback support and could potentially bounce off this level to climb higher.
Buy entry is at 19,126.47 which is a pullback support that aligns with the 50.0% Fibonacci retracement level.
Stop loss is at 19,000.00 which is a level that lies underneath a pullback support and the 61.8% Fibonacci retracement level.
Take profit is at 19,337.11 which is a pullback resistance.
High Risk Investment Warning
Trading Forex/CFDs on margin carries a high level of risk and may not be suitable for all investors. Leverage can work against you.
Stratos Markets Limited (www.fxcm.com):
CFDs are complex instruments and come with a high risk of losing money rapidly due to leverage. 62% of retail investor accounts lose money when trading CFDs with this provider. You should consider whether you understand how CFDs work and whether you can afford to take the high risk of losing your money.
Stratos Europe Ltd (www.fxcm.com):
CFDs are complex instruments and come with a high risk of losing money rapidly due to leverage. 59% of retail investor accounts lose money when trading CFDs with this provider. You should consider whether you understand how CFDs work and whether you can afford to take the high risk of losing your money.
Stratos Trading Pty. Limited (www.fxcm.com):
Trading FX/CFDs carries significant risks. FXCM AU (AFSL 309763), please read the Financial Services Guide, Product Disclosure Statement, Target Market Determination and Terms of Business at www.fxcm.com
Stratos Global LLC (www.fxcm.com):
Losses can exceed deposits.
Please be advised that the information presented on TradingView is provided to FXCM (‘Company’, ‘we’) by a third-party provider (‘TFA Global Pte Ltd’). Please be reminded that you are solely responsible for the trading decisions on your account. There is a very high degree of risk involved in trading. Any information and/or content is intended entirely for research, educational and informational purposes only and does not constitute investment or consultation advice or investment strategy. The information is not tailored to the investment needs of any specific person and therefore does not involve a consideration of any of the investment objectives, financial situation or needs of any viewer that may receive it. Kindly also note that past performance is not a reliable indicator of future results. Actual results may differ materially from those anticipated in forward-looking or past performance statements. We assume no liability as to the accuracy or completeness of any of the information and/or content provided herein and the Company cannot be held responsible for any omission, mistake nor for any loss or damage including without limitation to any loss of profit which may arise from reliance on any information supplied by TFA Global Pte Ltd.
The speaker(s) is neither an employee, agent nor representative of FXCM and is therefore acting independently. The opinions given are their own, constitute general market commentary, and do not constitute the opinion or advice of FXCM or any form of personal or investment advice. FXCM neither endorses nor guarantees offerings of third-party speakers, nor is FXCM responsible for the content, veracity or opinions of third-party speakers, presenters or participants.
