NAS - LOOKING FOR RECOVERTeam This morning we got out of beautiful SHORT on UK100
Market dumping hard due to ISRAEL'S and Iran
However we expect market to be recover during UK market opening
Please follow the price accordingly to the chart
Once it reach 1st target, take 50-70% profit reduce the volume and bring stop loss to BE
LET'S GO.
US100 trade ideas

USTECPrevious analysis on May 30 found that the price came down to test the support level at 20,693 but could not break through. Now the price has returned to test the resistance level at 21,737-22,139 again. If the price cannot break through the level of 22,139, it is expected that the price will drop. Consider selling in the red zone.
🔥Trading futures, forex, CFDs and stocks carries a risk of loss.
Please consider carefully whether such trading is suitable for you.
>>GooD Luck 😊
❤️ Like and subscribe to never miss a new idea!

NDX CRACK!I will keep this simple.
The rising wedge broke. Markets are in trouble.
The Trump disaster keeps escalating every day.
This is what the world looks like without the US
strong leadership defending freedom and democracy. CHAOS!

#NASDAQ (4H)"NASDAQ futures (4H) will dropped from 21,938.3 to 21,562.0 — one of the key indicators from the specified zone."
First Target Zone 19,245 To 18,842

ICT cheat code 15 minutes strategy using frankfort timeThis is the guideline on how to use the strategy
1.Identify accunilation ,minipulation
2.Use 06:00 to 07:00 for entry point
3.Identify either a ifvg or fvg
4.Enter at the specific time stated.
5.Target 2 takeprofits 200 pips and 300 pips
Use as stated ill be active and post at those times to show prove of strategy

SNIPER Smart money NASDAQ
🟢 Smart Money Sniper Analysis – NASDAQ (US100) H4
✒️ By Talion-Promosale
📅 June 12, 2025
🔹 Current Price: 21,867
🔹 RSI(14): 52.49 (neutral to slightly bullish momentum)
🔹 Market Structure: Bullish – price forming higher lows above key EMAs
🔹 Price is above the 200 EMA (white), and testing the 50 EMA (red)
🔹 Smart Money Zone: Last bullish order block between 21,700 – 21,740
---
🎯 Trading Signal – BUY (Smart Money Sniper Setup)
Sniper Entry Zone: 21,700 – 21,740 (Bullish Order Block + dynamic EMA support)
Confirmation Entry: Above 21,870
Take Profit 1 (TP1): 22,000
Take Profit 2 (TP2): 22,150
Stop Loss (SL): 21,620
💡 Context:
Price action remains bullish, supported by the 200 EMA and a clean rejection near the 50 EMA. RSI is above 50, indicating potential for upward continuation. The Smart Money zone between 21,700 and 21,740 serves as an ideal sniper re-entry area.
If price re-tests this order block with bullish rejection candles, it presents a high-probability buy opportunity. A break and close above 21,870 confirms momentum toward 22,000 and higher.
---
⛔ Invalidation:
A strong bearish close below 21,620 on the H4 chart would invalidate the bullish scenario.

Bearish reversal off pullback resistance?USTEC is rising toward the pivot, which serves as a pullback resistance. A reversal from this level could indicate a double top pattern, potentially leading to a price drop to the 1st support.
Pivot: 22,270.83
1st Support: 21,142.23
1st Resistance: 23,070.85
Risk Warning:
Trading Forex and CFDs carries a high level of risk to your capital and you should only trade with money you can afford to lose. Trading Forex and CFDs may not be suitable for all investors, so please ensure that you fully understand the risks involved and seek independent advice if necessary.
Disclaimer:
The above opinions given constitute general market commentary, and do not constitute the opinion or advice of IC Markets or any form of personal or investment advice.
Any opinions, news, research, analyses, prices, other information, or links to third-party sites contained on this website are provided on an "as-is" basis, are intended only to be informative, is not an advice nor a recommendation, nor research, or a record of our trading prices, or an offer of, or solicitation for a transaction in any financial instrument and thus should not be treated as such. The information provided does not involve any specific investment objectives, financial situation and needs of any specific person who may receive it. Please be aware, that past performance is not a reliable indicator of future performance and/or results. Past Performance or Forward-looking scenarios based upon the reasonable beliefs of the third-party provider are not a guarantee of future performance. Actual results may differ materially from those anticipated in forward-looking or past performance statements. IC Markets makes no representation or warranty and assumes no liability as to the accuracy or completeness of the information provided, nor any loss arising from any investment based on a recommendation, forecast or any information supplied by any third-party.

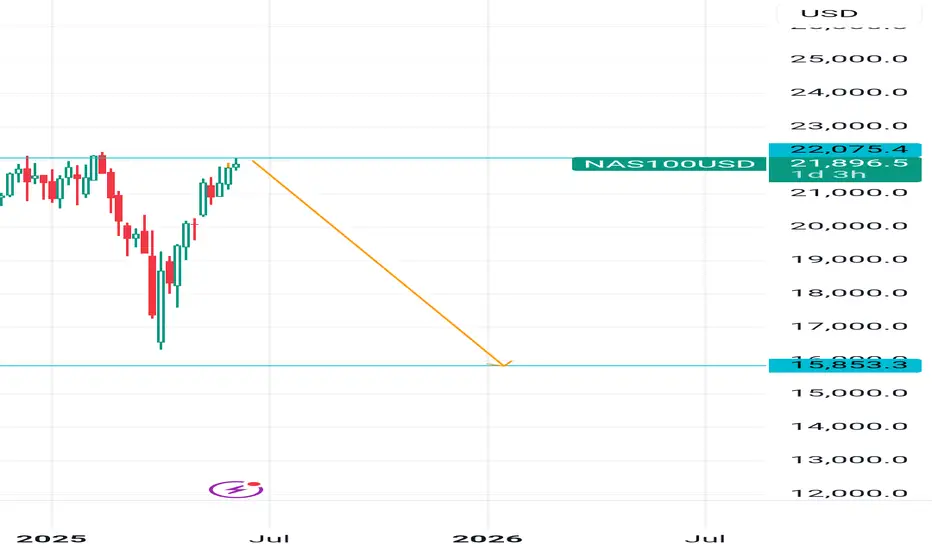
Bulls game over now 15853 incoming Short from 22000 Tp 15853.. Weekly TF big move down incoming.. Bulls Fasten your seatbelt please.. Good luck and safe trade
BUY STOP NAS100 AT 22000I will be buying Nas100 at 22000. I will hold the buy to the last high of the daily TF being 22200. Nas100 moves in 1000. Therefore, 2200 is a definite buy.

NASDAQ ShortLooking for the short on Nasdaq been trading this long and short through out the week. Check the linked publications. Shouted out 22,000 before seeing the short.

US100 - Riding the Ascending Channel Towards $22800NASDAQ is showing a very clear and well-respected ascending channel, with price moving steadily within its bounds. Each pullback has been relatively shallow, and buyers continue to step in near the midline or lower boundary of the channel. This is classic trending behavior, with bullish structure intact and momentum favoring continuation higher.
Break and Flip of Resistance into Support
A key resistance level has just been broken, and more importantly, it has now flipped into support. Price retested this zone cleanly after the breakout, confirming the shift in order flow and adding confidence to the current leg up. This kind of structure shift is significant, especially when paired with a strong trending environment like this one.
Daily Resistance Ahead
Looking ahead, there’s a major daily resistance level just above. This area has acted as a reaction zone in the past and will likely bring some short-term volatility or hesitation. However, in the context of the current trend, that resistance could be used as fuel for the next breakout. If price manages to pierce through it with strength and hold above, it would open the path for a move toward the upper boundary of the channel.
Plan and Expectation
The ideal scenario now is simple: I want to see a clean break above the daily resistance, followed by a retest and confirmation of support. That would set up a strong continuation move targeting the top of the channel. If the resistance holds, I’ll wait for signs of weakness or range formation, but as long as we remain inside this rising structure, the bias remains bullish.
Disclosure: I am part of Trade Nation's Influencer program and receive a monthly fee for using their TradingView charts in my analysis.
___________________________________
Thanks for your support!
If you found this idea helpful or learned something new, drop a like 👍 and leave a comment, I’d love to hear your thoughts! 🚀

NS100 IS BULLISHPEPPERSTONE:NAS100 , The journey to NAS100 ATH is all about to kickstart, and it will do us good not to miss this moves. On this post, i shared analysis about NAS100 combining both H4, Daily and WeeklyTF together to form this analysis, for further details, see the content of the post.

NASDAQ 100 Long 21,900Target to the upside 21,900. We initially highlighted NASDAQ will reach 22,000 then see a bearish turn. Refer to linked Idea.

NAS100 Bullish Trend Still IntactPrice being in resistance zones should not be an automatic sign that we should start selling. The trend is still bullish until we see clear signs of a reversal.

USNAS100 | Breakout or Breakdown?USNAS100 | OVERVIEW
The price is currently stabilizing below the pivot level at 21790, suggesting continued bearish momentum.
📉 As long as the index remains below 21790, we expect a decline toward 21635. A confirmed 1H candle close below this level could extend the bearish trend toward 21470.
📈 A shift to bullish momentum will require a 1H candle close above 21820, which could open the way to 22090 and potentially a new all-time high at 22200.
Support Lines: 21635, 21470
Resistance Lines: 21930, 22090, 22200


NDX its a short for like month?this is only an Idea !
due to many fvg's and gaps this is more likely to happen
you can see the long 30d / 40d target on chart

NASDAQ Potential UpsidesHey Traders, in today's trading session we are monitoring NAS100 for a buying opportunity around 21,700 zone, NASDAQ is trading in an uptrend and currently is in a correction phase in which it is approaching the trend at 21,700 support and resistance area.
Trade safe, Joe.


BUY POSITIONToday im looking at buy positions to the highlighted target continue to make higher highs

NasDaq100 CPI Break-Down NasDaq100 price broke resistance level at $22,006. We waited for price to correct back to resistance level then we entered buy's when continued above $22,006.


Staircase seen in real chartsFor the most part OANDA:NAS100USD has exhibited a near perfect staircase up so far.
It does appear fairly extended right now, but with rotation out of safe havens into risk on assets again, what remains to be seen is how much fuel is in the tank, and how far can the tailwind take it.
