Dow Jones is Nearing an Important Support!!Hey Traders, in today's trading session we are monitoring US30 for a buying opportunity around 43,950 zone, Dow Jones is trading in an uptrend and currently is in a correction phase in which it is approaching the trend at 43,950 support and resistance area.
Trade safe, Joe.

US30 Robbery Blueprint: Breakout, Pullback, Escape Setup💎 Dow Jones Robbery Blueprint: The US30 Vault Crack Plan 💎
(Maximized for reach — within TradingView title limit)
🌟Hi! Hola! Ola! Bonjour! Hallo! Marhaba!🌟
Dear Market Robbers & Money Movers 🕵️♂️💰🚨
This ain't your average analysis — it’s a Thief Trader-style 🔥tactical mission🔥 aimed at the mighty

KOG - US30US30
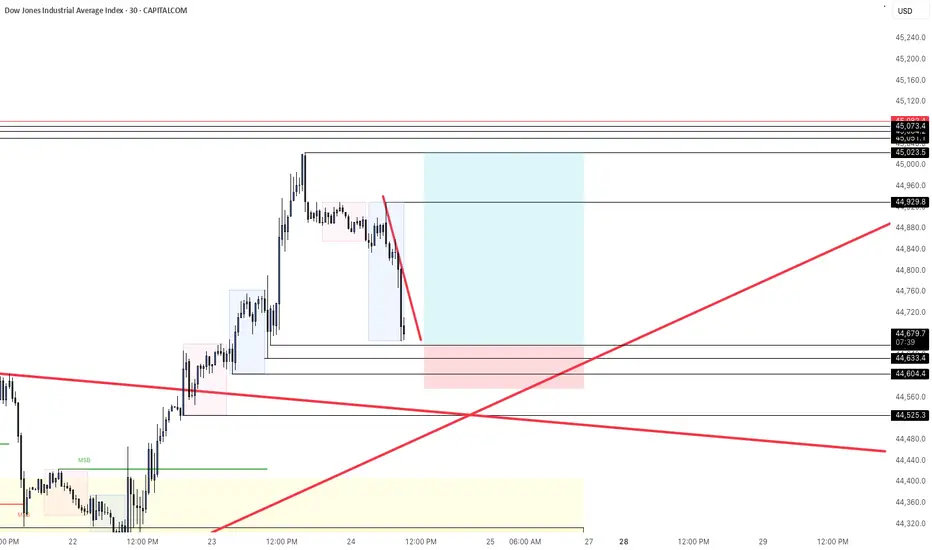
Looking at this we have a clean reversal in play suggesting we’re going to get lower order regions before a potential RIP. The red boxes have been added and may give us opportunities to capture the tap and bounces on the smaller TFs.
If we can support lower, we could very well see this pus

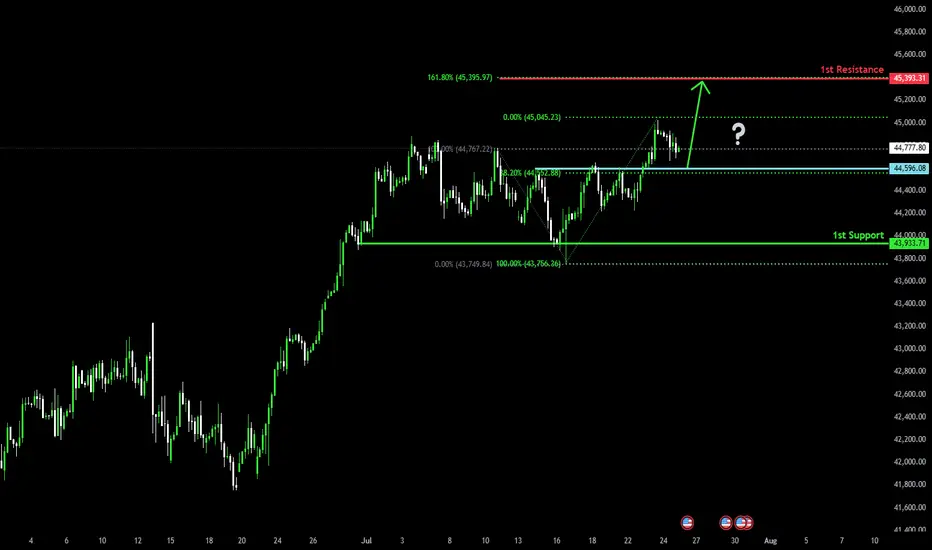
Bullish bounce off pullback support?Dow Jones (US30) is falling towards the pivot and could bounce to the 161.8% Fibonacci resistance.
Pivot: 44,596.08
1st Support: 43,933.71
1st Resistance: 45,393.31
Risk Warning:
Trading Forex and CFDs carries a high level of risk to your capital and you should only trade with money you can affo
US30 (Dow Jones) may return to growthThe Dow Jones is declining (correction) following a technical false breakout, as well as local news. The overall trend is upward, with the correction serving as a means to gather liquidity prior to growth. Confirmed support, previously consolidation resistance, at 44600 can be considered a reference

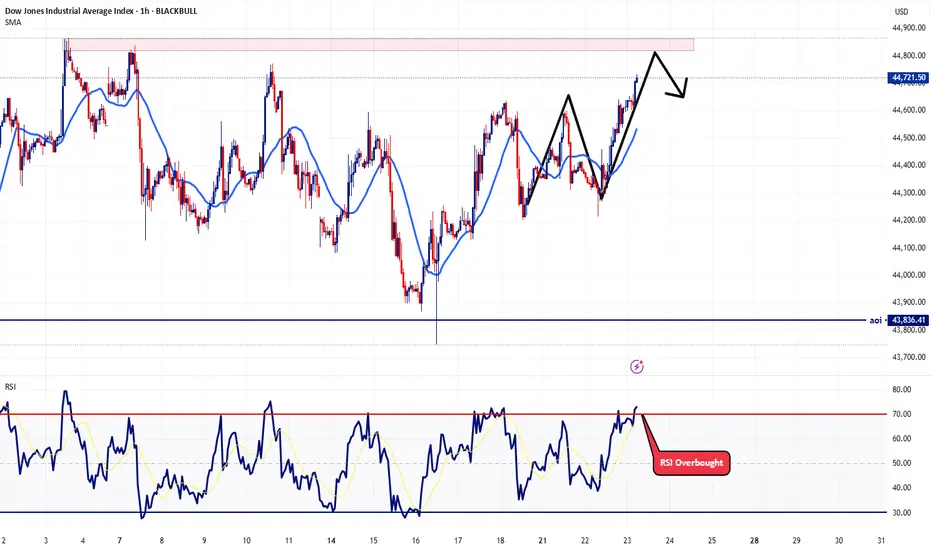
US30 continues to exhibit bullish momentumThe US30 index continues to exhibit bullish momentum, driven by strong earnings reports and robust U.S. economic data. The key support zone around 44,300 has held firm, reinforcing confidence among buyers.
As long as the price remains above 44,300, the uptrend is expected to persist Upside target:

US30 - LONGAfter a huge push to the upside price came down during the asian/London session. Looking for buyers to take over once again and push back to yesterday's highs. Being patient as always and waiting for confirmation around my entry zone.
US30 bearish setup; Price at key resistance _ Target at 44400Technically, US30 price is currently challenging a significant resistance level at 44830. This area has historically been a strong turning point, suggesting a potential reversal. Our entry at 44830 is positioned to capitalize on a confirmed rejection from this level. The stop loss at 44952 provides

US30 - What I believe will happen todayConsidering today is now Wednesday and Wednesday's have a consistency of being one of those off days. Primarily because usually there are Fed speeches on this day that manipulate the market. With that said, I'm expecting price action to play out how I plotted the arrows on the chart. I believe there
US30: Local Bearish Bias! Short!
My dear friends,
Today we will analyse US30 together☺️
The in-trend continuation seems likely as the current long-term trend appears to be strong, and price is holding below a key level of 44,774.9 So a bearish continuation seems plausible, targeting the next low. We should enter on confirmatio

See all ideas
Summarizing what the indicators are suggesting.
Oscillators
Neutral
SellBuy
Strong sellStrong buy
Strong sellSellNeutralBuyStrong buy
Oscillators
Neutral
SellBuy
Strong sellStrong buy
Strong sellSellNeutralBuyStrong buy
Summary
Neutral
SellBuy
Strong sellStrong buy
Strong sellSellNeutralBuyStrong buy
Summary
Neutral
SellBuy
Strong sellStrong buy
Strong sellSellNeutralBuyStrong buy
Summary
Neutral
SellBuy
Strong sellStrong buy
Strong sellSellNeutralBuyStrong buy
Moving Averages
Neutral
SellBuy
Strong sellStrong buy
Strong sellSellNeutralBuyStrong buy
Moving Averages
Neutral
SellBuy
Strong sellStrong buy
Strong sellSellNeutralBuyStrong buy
Displays a symbol's price movements over previous years to identify recurring trends.
Frequently Asked Questions
The current value of Dow Jones Industrial Average Index is 44,901.26 USD — it has risen by 0.35% in the past 24 hours. Track the index more closely on the Dow Jones Industrial Average Index chart.
Dow Jones Industrial Average Index reached its highest quote on Nov 29, 2024 — 45,077.01 USD. See more data on the Dow Jones Industrial Average Index chart.
The lowest ever quote of Dow Jones Industrial Average Index is 18,170.00 USD. It was reached on Mar 23, 2020. See more data on the Dow Jones Industrial Average Index chart.
Dow Jones Industrial Average Index value has increased by 0.90% in the past week, since last month it has shown a 4.24% increase, and over the year it's increased by 12.40%. Keep track of all changes on the Dow Jones Industrial Average Index chart.
Dow Jones Industrial Average Index is just a number that lets you track performance of the instruments comprising the index, so you can't invest in it directly. But you can buy Dow Jones Industrial Average Index futures or funds or invest in its components.