US30 trade ideas

US30 - BullishUS30 formed a double bottom and broke its neckline confirming bullish reversal. Now it is testing 0.5-0.618 Fib level of its last bullish leg.

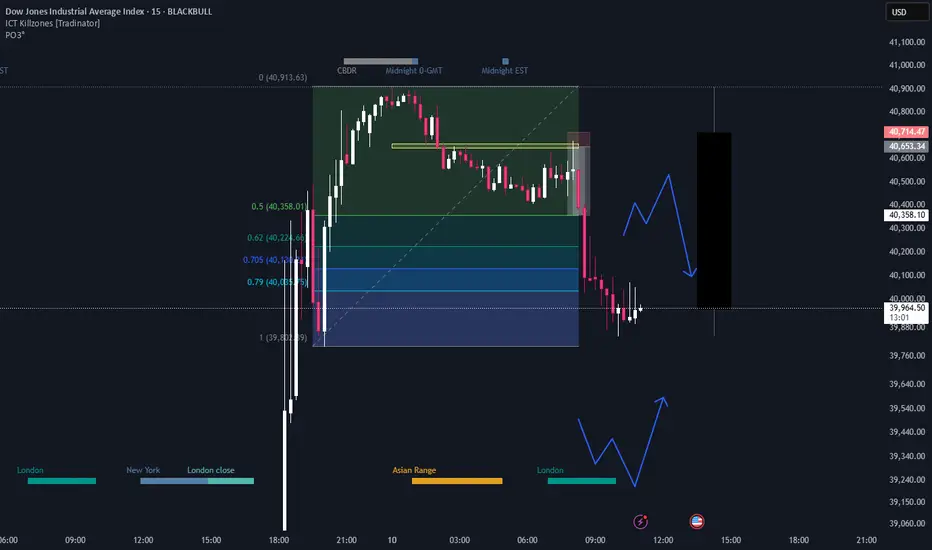
Strong downward momentum visibleTrend: Strong downward momentum visible prior to current consolidation.
Setup: Price has bounced slightly and appears to be retesting a broken structure (possible resistance at ~40,000).

US30: Target Is Up! Long!
My dear friends,
Today we will analyse US30 together☺️
The recent price action suggests a shift in mid-term momentum. A break above the current local range around 39,680.80 will confirm the new direction upwards with the target being the next key level of 40,416.97 and a reconvened placement of a stop-loss beyond the range.
❤️Sending you lots of Love and Hugs❤️

Dow Jones US30 - Buy Cycle- SpotUS30
Spot
Buy cycle
Tp@44989
% bubble ratio
Dowjones in long term negative bubble (buy cycle), closing target at 44989 as its fair value.
Spot trading plan:
Starting to buy at -50% bubble ratio and below

US30: Downtrend vs. Support Battle - What's Next?US30 Daily Analysis
Technical Outlook — 10 April 2025
Current Market Condition:
US30 is currently in a defined downtrend on the daily timeframe, characterized by a series of lower highs and lower lows. The price has recently broken down from a potential bearish wedge pattern and is trading below key moving averages.
Key Technical Highlights:
Clear bearish structure evident with consecutive lower highs and lows.
Price has broken down from a potential bearish wedge formation, suggesting further downside.
Trading below the 50-day and 200-day Exponential Moving Averages (EMAs), indicating bearish momentum.
Key Support Zones identified around $37,000 - $37,500 and $35,800 - $36,200.
Key Resistance Zones located around $42,000, $45,000, and $47,800 - $48,000.
Momentum oscillator (MACD or similar) showing bearish momentum.
Possible Scenarios:
Bearish Scenario (High Probability):
If price remains below the descending trendline (around $40,000 - $41,000) and fails to reclaim the $37,500 level, expect bearish continuation.
A confirmed break below the $37,000 - $37,500 support zone could lead to targets at the $35,800 - $36,200 support zone.
Confluence of the bearish trendline and moving averages adds to the potential selling pressure.
Bullish Scenario (Invalidation Level):
A break and sustained trading above the descending trendline and the $42,000 resistance level could signal a potential short-term pullback towards higher resistance levels around $45,000.
Strong bullish reversal signals within the $37,000 - $37,500 support zone could also indicate a potential bounce.
Important Note:
Be aware of any upcoming economic data releases that could impact US indices and cause volatility.
Wait for clear candle confirmations at key levels before initiating trades.
Implement robust risk management strategies, including appropriate stop-loss placement.
If you found this analysis valuable, kindly consider boosting and following for more updates.
Disclaimer: This content is intended for educational purposes only and does not constitute financial advice.

Dow Jones INTRADAY oversold bounce back Key Support and Resistance Levels
Resistance Level 1: 41100
Resistance Level 2: 42170
Resistance Level 3: 42800
Support Level 1: 37554
Support Level 2: 36620
Support Level 3: 35125
This communication is for informational purposes only and should not be viewed as any form of recommendation as to a particular course of action or as investment advice. It is not intended as an offer or solicitation for the purchase or sale of any financial instrument or as an official confirmation of any transaction. Opinions, estimates and assumptions expressed herein are made as of the date of this communication and are subject to change without notice. This communication has been prepared based upon information, including market prices, data and other information, believed to be reliable; however, Trade Nation does not warrant its completeness or accuracy. All market prices and market data contained in or attached to this communication are indicative and subject to change without notice.

NFP NQ / US30 advise for u read description i took this trade today early now the market should react from one of this places i mention, pls be aware never ever take the trade before NFP /15 min before / always wait NFP and market will gave u other entry after 45 to 60 min after NFP dont be gambler and put all ur heart . Wait like pro and take trade after nfp 45 to 60 min be safe much love and respect
any question fell free to ask id like to answer any Questions
DOW JONES INDEX (US30): Bearish More From Resistance
It looks like US30 is returning to a bearish trend again.
I see a strong bearish sentiment after a test of a key daily resistance.
The price formed an inverted cup and handle pattern and we see
a strong bearish imbalance with London session opening.
Goal - 39.685
❤️Please, support my work with like, thank you!❤️
I am part of Trade Nation's Influencer program and receive a monthly fee for using their TradingView charts in my analysis.

Us30 LongWe have a fresh/original zone at 40150 of which i expect price to pull back to and reject it and continue with the rally


FXBG JOURNAL (US30 SHORT) 9/04/2025 BEFOREFollowing Bearish Price Action . Decided to take shorts from the recent bearish Orderblock.

Intraday Entry 2Everything is pretty much explained in the picture itself.
I am Abhishek Srivastava | SEBI-Certified Research and Equity Derivative Analyst from Delhi with 4+ years of experience.
I focus on simplifying equity markets through technical analysis. On Trading View, I share easy-to-understand insights to help traders and investors make better decisions.
Kindly check my older shared stock results on my profile to make a firm decision to invest in this.
Kindly dm for further assistance it is for free just for this stock.
Thank you and invest wisely.

DJ is setting up for a SLINGSHOT to the upside!The "crash" in the DJ could potentially bottom out by late April or early May, at least from a cyclical standpoint. That said, there's still a risk of a further decline into June, as a panic cycle is approaching.
However, from a technical perspective, the weekly chart of the DJ reveals a significant demand imbalance that aligns with cyclical support, suggesting the potential for a major low.
Regardless, the stage is being set for a SLINGSHOT to the upside, as capital begins to flee Europe and flow into the U.S. amid rising global tensions and uncertainty.
Both the DJ and Gold are poised to reach new all-time highs ahead!

US30Taking advantage of the bear market on indices we’re going to wait for it to break this key level, retest then take our entries on the smaller timeframe

US30 — Support Holding or Further Drop? Key Levels To WatchUS30 (Dow Jones) — 4H Chart
Price is currently hovering around a key support zone near 37,000 after a strong bearish impulse.
Scenarios I'm Watching:
▸ Bullish Scenario:
If the support zone holds and price reclaims 37,500 — I would look for price to retest the 38,300-38,800 zone.
A clean break and hold above 39,500 could open doors towards the 40,000-41,000 resistance area.
▸ Bearish Scenario:
If price fails to hold this support, and breaks below 36,850 — I expect further downside towards the next key supports:
35,800
34,500
33,000
Trading Plan:
Waiting for clear price action confirmation at this support zone.
Will avoid trading in the middle of the range — prefer breakout or retest setups.
Levels marked on chart for clarity.
If you found this analysis valuable, kindly consider boosting and following for more updates.
Disclaimer: This content is intended for educational purposes only and does not constitute financial advice.
