GC1: Buy ideaOn GC1 as you can see on the graph, we would have a high probability of seeing the market go up if all the analysis conditions are met.
ORO1! trade ideas

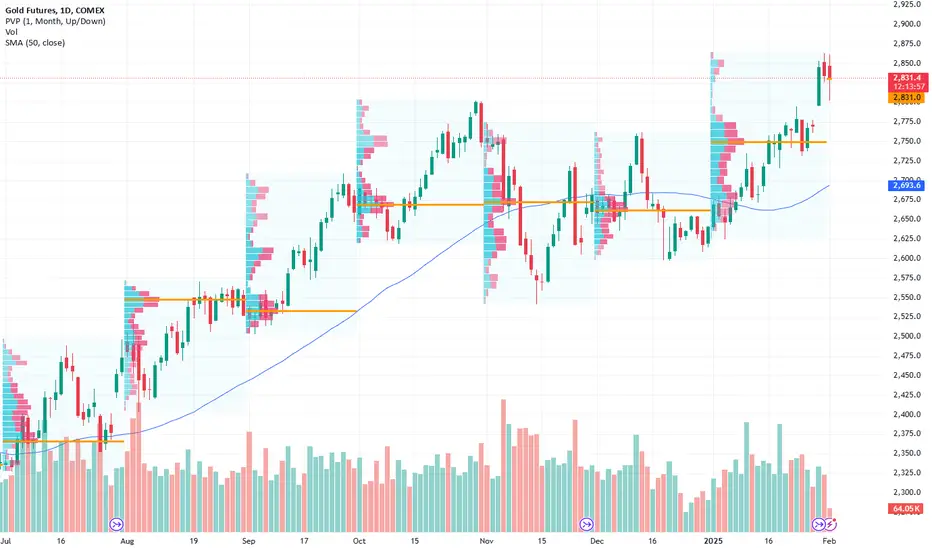
The 3rd Major Pivot in Gold’s Uptrend - Since Trade War in 2018We just witnessed the start of another pivot in gold when Trump won the U.S. presidential election in November 2024. My gold trading strategy has always focused on buying dips while keeping any short-selling opportunities short-term.
The chart above clearly illustrates three major V-shaped formations in gold. After each tariff or trade war, a V-shaped pattern formed in the same month the policy was initiated, followed by a subsequent uptrend.
Recently, I published a video analyzing other significant tariffs since the U.S.-China trade war began in 2018. We observed a consistent pattern: after each tariff or trade war, the same month of policy initiation saw the formation of a V-shaped trough, followed by an uptrend.
This time, the V-shaped trough occurred during the U.S. presidential election month. The right side of this V-shape was completed with the announcement of 25% tariffs on Canada and Mexico, signaling the expansion of the trade war beyond China.
The consequence of trade wars is inflation, and gold has historically served as a leading indicator of this trend.
If the trade war persists and intensifies, a continued uptrend in gold seems inevitable. Analyzing the long-term monthly chart using my parallel channel approach, we observed gold prices encountering resistance around $2,600 in September 2024 and beyond. However, by the close of January, the price action provided a clear confirmation of the ongoing gold uptrend. Gold firmly closed above $2,600, reaching $2,835 for COMEX Micro Gold Futures.
On the 3-hour chart, I have provided another set of parallel channels as a guide to track support and resistance levels as gold trends further.
As gold prices continue to climb, their notional value can become quite large for retail traders. COMEX Micro Gold Futures, being 1/10th the size of the regular gold contract, is a better option for me when the next buying opportunity arises. Recently, CME launched a new contract—a pocket-sized one-ounce gold contract. One key to successful trading is selecting the right contract size for oneself, which is crucial for effective risk management.
Once again, my strategy for gold remains the same: focus on buying dips while keeping any short-selling opportunities short-term.
Please see the following disclaimer and information that you may find useful:
Gold Contracts:
Gold Futures & Options
Ticker: GC
Minimum fluctuation:
0.10 per troy ounce = $10.00
Micro Gold Futures & Options
Ticker: MGC
Minimum fluctuation:
0.10 er troy ounce = $1.00
1Ounce Gold Futures
Ticker: 1OZ
Minimum fluctuation:
0.25 per troy ounce = $0.25
Disclaimer:
• What presented here is not a recommendation, please consult your licensed broker.
• My mission is to create lateral thinking skills for every investor and trader, knowing when to take a calculated risk with market uncertainty and a bolder risk when opportunity arises.
CME Real-time Market Data help identify trading set-ups in real-time and express my market views. If you have futures in your trading portfolio, you can check out on CME Group data plans available that suit your trading needs www.tradingview.com

GC1! Gold Futures Longs!I'm looking for long positions on GC1 Gold Futures and this is looking to be my entry point on the 15m time frame.
I can dive deeper into the analysis if anyone would like me to.
hope this helps.

This is a Wyckoff VSA Test in a Rising Market NasdaqThis short video shows a classic Wyckoff Volume Spread Analysis set up, a Test in a Rising Market.

Gold will close the Week with New Highs!Price is very Aggressive as we come into Asian Killzone. Looking for price to completely break out and close the week. But being that it is Friday keep expectations low.

How to get more than 10% gain in Gold in single tradewhen gold deep down more than 8% just check previouse support and mark high for tgt from previous low to high consitant movement not any swing high low between high and low like in this video and get 15 to 20% gain in single trade,
share,like

Gold Update: $3,000 Is Not the Final DestinationGold futures broke above minor consolidation, so the map should be updated.
Wave 3 becomes extended (blue small waves) and it is looking to test the trendline resistance near magic $3,000 level.
But that's not all as we didn't see wave 4 yet.
It should be complex to alternate wave 2, which was simple.
Wave 4 could hit the $2,500-2,550 area to complete correction.
We can measure it after wave 3 will be completed.
And finally, wave 5 is usually extended in commodities.
It could be huge, wave 3 already travelled over $1,000,
imagine where wave 5 could rocket then.
It will depend on how deep wave 4 would retrace first.
Stay tuned, share your thoughts below, lucky trades to all of you!

Book profit in Gold 4000 point, Tgt done 85000My Gold 2nd Tgt is 85000, and gold made 84894 high yesterday, if any one create position in gold please book profit, and wait for next update or breakout, chartpattern etc,
follow me for more update, share my idea to your friends and family.

Gold is Holding the the bullish Pressure! Price moved bullish yesterday then stalled during NY session and ended up pulling back for the rest of the day. As we come into Asian session for a new day the question is will they retrace to give a low entry or just run and gun it out the gate? We just have to be patient and wait for it.

MGC1! SELLAfter series of various bullish maneuvers, it failed to break a higher high.
The presence of a bearish pattern like the H&S which shows the rejection coming in. I hope to see a clean breakdown to the downside.
What do you think? Follow and Like for ideas.

Gold major breakout ? Major breakout of trendline in gold on weekly basis.
Can zoom to 92-95 levels very soon.

GOLD IS HOT RIGHT NOW!!!The moves are on FIRE!!! Looking for the bullish momentum to continue. Price has moved above the previous daily level and the area is starting to hold. As we push up I'm looking for a entry inside of the Asian session's Kill zone.

GC - Futures Gold - Short term bearish then bullish moveBased on confluences, a bullish move will likely continue after a short-term bearish retracement. I am not a financial advisor, trade at your own risk.

Gold continues higher within its well-established channelGold continues higher within its well-established channel, reaching a fresh record high at $2837. Interesting to note the spread between XAUUSD and GCJ5 continues to normalise with cash chasing higher towards the futures price. Win-win.

TARGET REACHED ON OUR TRADEEarlier I posted to buy on Gold, and the market now reached our target to continue going higher and higher.
Follow for more!

BUY GC1!Good morning traders!
I'm sharing this trade for futures traders, you can place the same order as mine, so the market can fill it when it gets back to the entry point.
Follow for more!

GOLD Setting up for a nice run!Now that we are in a new week and new month it looks like its setting up for a big move. Just have to wait for the killzones for a solid entry. I just need to see it fill in some gaps. Waiting for the Asian range but it looks like it might be bearish until the London session. For London we could see a sweep and then aggressive push to go bullish. We just have to wait and see.

- Aiming for Long Positions in Gold as Bullish Momentum Persists- Key Insights: Gold's recent all-time high showcases strong bullish sentiment.
The market is buoyed by geopolitical uncertainties that drive investors
toward gold as a safe-haven asset. Monitoring for potential corrections
remains critical. Consider entering long positions as the overall trend
continues positively.
- Price Targets: Next week targets are T1 at $2,900 and T2 at $3,000. Stop
levels are S1 at $2,760 and S2 at $2,740.
- Recent Performance: Gold has maintained a strong trajectory amidst favorable
commodity movements and high trading volumes. The precious metal's status as
a preferred asset has led to its outperformance compared to many traditional
equities, reflecting its desirability during volatile periods.
- Expert Analysis: Analysts maintain a bullish outlook, while cautioning about
potential corrections due to rising short positions. Continued capital
rotation into gold suggests that institutional flows will likely push prices
further. Traders should pay attention to market signals reflecting shifts in
sentiment.
- News Impact: Growing geopolitical tensions and tariff concerns heighten gold's
strategic importance as a safe-haven investment. Recent initiatives in Saudi
Arabia to engage with gold supply chains indicate heightened market demand.
Ongoing developments in the GLD ETF reveal strong investor interest, further
supporting bullish sentiment around gold.
Micro Gold going back to (2785)Gold had a great push up on Friday , but it looks like pull back back to the 2785 ish area.

Trading Gold Futures Amid Global Trade TensionsCOMEX: Micro Gold Futures ( COMEX_MINI:MGC1! ) #Microfutures
The United States will be implementing new tariffs on Saturday, February 1st, including 25% tariffs on Mexico and Canada as well as a 10% duty on all goods from China. These countries are the Top 3 U.S. trading partners, contributing to 40% of all goods and services imported into the US in 2023, collectively.
On Friday, gold prices surpassed the key $2,800 mark for the first time ever. Spot gold rose 0.6% to $2,810.55 per troy ounce, after hitting a record high of $2,817.23. The record rally is fueled by a flight to safety as trade tensions rise.
Gold futures are trading at a premium to spot gold prices. The lead April contract of the benchmark COMEX gold futures settled at $2,833 on Friday.
Looking back, the trade tensions between the US and China have intensified since 2018. This time, higher tariffs will be applied globally, not only to competitors of U.S. interests, but also to close allies such as Canada, Mexico and the European Union.
Lessons from the US-China Trade Conflict
How would the global trade conflicts shape up? Uncertainties remain elevated. Luckily, the US-China trade conflict provides us historical lessons with present-day relevancy.
Let’s have a quick review of the major timeline of key events:
• July 6, 2018: The trade conflict begins as the US imposes 25% tariffs on $34 billion worth of Chinese goods. China retaliates with tariffs on an equal amount of US goods.
• August 23, 2018: The US imposes additional 25% tariffs on another $16 billion worth of Chinese goods. China responds with tariffs on $16 billion worth of US goods.
• September 24, 2018: The US imposes 10% tariffs on $200 billion worth of Chinese imports. China retaliates with tariffs on $60 billion worth of US goods.
• December 1, 2018: A temporary truce is agreed upon during the G20 summit, with a 90-day period for negotiations.
• January 15, 2020: The "Phase One" trade deal is signed, easing some tariffs and committing China to increase purchases of US goods.
Gold prices responded quickly at each stage of the trade conflict, creating ample trading opportunities. On June 7, 2022, I published “Event-Driven Strategy Focusing on Global Crisis” on TradingView, based on my own trading experience from 2018-19. A link to this write-up is provided here for your information:
In summary, I observed patterns in gold prices while the trade conflict was progressing, and designed event-driven strategy based on Game Theory. Here are the highlights:
• US initiated new tariffs; Gold prices went up (“Risk On”)
• China retaliated with new tariffs; Gold prices went up further ("Risk On”)
• US and China announced trade negotiations; Gold prices went down (“Risk Off”)
• Negotiations broke down followed by new tariffs; Gold prices went up (“Risk On”)
• Negotiations resumed; Gold prices went down (“Risk Off”)
• Trade agreement was reached; Gold prices went down sharply (“Risk Off”)
The “Fight-and-Talk” could go multiple rounds, pushing tariffs to higher levels. Just how high?
China previously maintained a 12% import tariff on U.S. pork products. In its first round of trade retaliation in 2018, China imposed an additional 25% tariff on US pork. A month later, another 25% was added. Pork tariff went up a further 10% in the third round of retaliation, making the total tariff on US pork at a mind-boggling 72%!
As shown in the chart, gold responded in an observable manner following each key event. This repetitive pattern made it possible to set up trades in anticipation of the next moves.
The Sequence of Next Moves in Trade Conflicts
Learning from the previous experience, we could simulate a series of scenarios when new tariffs are imposed on goods from Canada, Mexico, China and the EU.
• US initiates new tariffs; Gold prices go up (“Risk On”)
• The other country retaliates with new tariffs; Gold prices go up further ("Risk On”)
• The two countries announced trade negotiations; Gold prices go down (“Risk Off”)
• Trade agreement is reached; Gold prices go down sharply (“Risk Off”)
In my opinion, the countries involved would retaliate but may want to avoid a costly trade conflict dragging on. With the brutality of the last trade conflict still fresh in mind, trade deals could be reached more quickly. From a trading perspective, the Fight-and-Talk patterns could be repeated multiple times, making our event-driven strategy reusable.
Given that Canada, Mexico, China and the EU are the biggest U.S. trading partners, the price swing in gold could be more volatile. Conflicts with smaller trading partners, such as Taiwan and the Southeastern Asian countries, may not trigger big moves in gold.
The CFTC Commitments of Traders report shows that on January 28th, total Open Interest (OI) for Gold Futures is 577,505, up 15% from the level last November when the U.S. election was held. Interest in using gold for trading or hedging goes up with the escalation of risk.
“Swap Dealers” own 363,051 contracts, making them the largest trader category to own gold futures positions.
• Swap Dealers have 29,725 in Long, 272,549 in Short, and 60,777 in Spreading
• The long-short ratio of 1:9 indicates that “Smart Money” is overwhelmingly bearish
There is another supporting factor for a bearish view:
A key driver in gold prices is the geopolitical crisis. President Trump announced that he planned to meet with President Xi of China within the first 100 days in office. A meeting between President Trump and Russian President Putin is also being planned.
As we know, bullion is a preferred asset during times of turmoil. We may soon see the geopolitical risks unwinding, which will send gold prices sharply down. This could happen when Russia and Ukraine end their military conflict with a peace treaty.
Trade Setup with Micro Gold Futures
If a trader shares a similar view, he could express his opinion by shorting the COMEX Micro Gold Futures ( AMEX:MGC ).
MGC contracts have a notional value of 10 troy ounces. With Friday settlement price of 2,833, each April contract (MGCJ5) has a notional value of $28,330. Buying or selling one contract requires an initial margin of $1,150.
The MGC contracts are very liquid. On Thursday, MGC has a daily trade volume of 126,712 contracts and an Open Interest of 30,633.
Hypothetically, a trader shorts April MGC contract and gold prices pull back 5% to 2,691. A short futures position would gain $1,420 (=142 x $10). Using the initial margin as cost base, a theoretical return would be +123% (= 1420 / 1150). The risk of shorting gold futures is rising gold prices. Investors could lose part of or all their initial margin.
Traders could express the same view with the standard COMEX Gold (GC) futures or the newly launched 1-ounce gold futures, which represent just 1/10 the size of a Micro Gold (MGC) futures contract and 1/100 of GC futures contract.
To learn more about all the Micro futures and options contracts traded on CME Group platform, you can check out the following site:
www.cmegroup.com
The Leap trading competition, sponsored by CME Group, will begin at TradingView on February 3rd. I encourage you to join The Leap and compete to be the best in CME Group futures trading and win a share of $25,000 in cash prizes or an additional six months to your TradingView subscription.
www.tradingview.com
Happy Trading.
Disclaimers
*Trade ideas cited above are for illustration only, as an integral part of a case study to demonstrate the fundamental concepts in risk management under the market scenarios being discussed. They shall not be construed as investment recommendations or advice. Nor are they used to promote any specific products, or services.
CME Real-time Market Data help identify trading set-ups and express my market views. If you have futures in your trading portfolio, you can check out on CME Group data plans available that suit your trading needs www.tradingview.com

GOLD, Short, 2h✅ GOLD is overbought and has broken out of its consolidation to the downside, indicating further bearish momentum. The price is expected to move toward the key support level.
SHORT 🔥
✅ Like and subscribe to never miss a new analysis! ✅

GC1 310125My trading plan is to wait for price to reach the drawn lines or boxes to look for entry signals. The drawn lines or boxes are strong support/resistance zones, these are potential reversal areas when price approaches. If price breaks out instead of reversing, this is where to wait for a retest to look for entry signals. Good luck my friend!

MCG 310125My trading plan is to wait for price to reach the drawn lines or boxes to look for entry signals. The drawn lines or boxes are strong support/resistance zones, these are potential reversal areas when price approaches. If price breaks out instead of reversing, this is where to wait for a retest to look for entry signals. Good luck my friend!
