Polygon (MATIC / BTC) Trade for the Bitcoin maxi 😎 (RR 1:8)Setup: Strong breakout of the consolidation zone and the 200 Moving Avarage on the daily timeframe. Pullback expected to test previous resistance.
Entry: I expect support at previous resistance and this is where my entry zone is based. Around the 200 MA (daily). Orange box.
Stoploss: Stoploss is below the consolidation zone @ 0.00001680. After making a new local high (above 0.00002890), I move my stoploss just above my entry; making the trade risk free.
Targets: Targets are calculated with the extended Fibonacci with the swing low/high of November. This is a typical sign of strength, especially when you look at the volume/buy pressure building up drawing this pattern.
First target is 1.618 of the extended fib, what happens to be the first real resistance zone after breakout of the local high. I take 50% off the table.
Final target is 4.236 of the extended fib. This target is near the all-time high.
I personally scale out of my position at the 2.618 and 3.618.
MATICBTC trade ideas


The right time to change BTC to MATIC.The MATIC/BTC chart has entered the buy range. Although this chart has the ability to correct 90%.

MATICBTC volume range mapping on 1htrading inside these boxes, let's see how the price behaves within them

MATIC---Looks ready for a parabolic pumpI have been chasing MATIC for a long time waiting for this moment. After months, the MATIC/BTC just reached my target 2 which is the best entry. Below that is just a wick caused by FUD. Yesterday we faced the Iran bombing Israel news which caused panic in the market. Nothing major, just situational fear.
Down to the point: What do I see in Matic TA wise
-I am waiting for the RSI (in the top) makes an intersection between both lines. That's when Matic will be bullish. In the meantime, its just accumulation.
-This is a Sweep/Buy pattern. This is one of the MOST bullish patterns you can find in Crypto.
-This is currently one of my most bullish charts in my Tradingview.
Target for Matic USDT wise is $5-20

FALLING WEDGE, WILL THINGS CHANGE?MATIC/BTC has been suffering in this downtrend. Though it keeps going down, it's now showing a reversal pattern, which may or not be the start of a change to an uptrend.
I'm going to keep my eyes open, waiting for trend change.

MATIC BTC hitting important lowsGreen lines are buys. If you were looking to long Matic this is an important area

Pretty lowMight be a good spot to start DCA in to this
Rsi is still under 50 and bearish but that can change relatively fast

✳️ Polygon | Potential Bottom Catch 🙌 Yesterday MATICBTC hit a 1.5 year long low and this can potentially be the bearish wave bottom... Let's dive in.
We are looking at Polygon vs Bitcoin on the daily timeframe.
After a peak in February, a major downtrend developed and yesterday a new low came in. This is the lowest price hit for MATICBTC since June 2022... If the reversal happens here, this can be great news.
The initial bounce after the October low is the first indication that the bearish wave is over or coming to an end. The lower low yesterday is not a strong lower low but rather a technical double bottom. Technical because a double bottom to be valid needs to be only in the vicinity of a previous low and not the exact same price.
If the low went 20-30% lower compared to October, that would definitely count as a lower low and bullish reversal potential would be so much weaker. That's not the case today.
So we have our double bottom and the lowest level in 1.5 years.
If a reversal happens now we have a bottom catch; Ultra-low risk, amazing potential for growth .
Namaste.

MATIC/BTC huge move About to happenMATIC / BTC
This massive horizontal support against BTC was greatest one for MATIC since 2021 and never broken since that
Price is testing it again and on a quickly reaction the weekly candle got absorbed indicating bulls are buying here
If bulls will save their ass here again, mega bullish move will be followed for MATIC in next weeks in both BTC and USDT charts
If this support lost we gonna cash hard
#DYOR

Good time to buy MATIC (Polygon)I think the bottom for MATIC/BTC is here.
If it breaks the previous low, you can sell with little loss.
There's a lot of room for growth.
Buy 2000~1850
Stoploss 1790
Sell 4500

📈📊 #ChartPattern Alert! 📈📊 📈 Falling Wedge 📈📈 What is a Falling Wedge? The Falling Wedge is a bullish chart pattern characterized by two converging trendlines, with the lower trendline sloping upward more than the upper trendline. It typically signals a potential bullish reversal, with the price likely to break upward after the wedge pattern.
📈 How to Identify:
Draw a trendline connecting at least two higher highs (upper trendline).
Draw another trendline connecting at least two higher lows (lower trendline).
📈 What it Signals: The Falling Wedge suggests a potential bullish reversal, with buyers gaining strength as the price reaches higher lows within the wedge. It often forms during downtrends and can precede a significant price move to the upside.
📈 Trade Strategy:
Consider buying when the price breaks above the upper trendline of the Falling Wedge.
Set profit targets based on the pattern's height added to the breakout point.
Implement a stop-loss to manage risk in case of a false breakout.
Remember to validate your analysis with other technical indicators and conduct thorough research before making any trading decisions. Happy charting and trading! 📈💹

MATIC not looking good!Here's a quick look at the MATIC / BTC pair.
The price is at a critical level, and if this level of 2000 sats can't be held, the price will likely get down to 1700 sats! It is, therefore, prudent to keep an eye on the 2000 sats level, as it will play a vital role in dictating the price direction in the upcoming months!
The overall altcoin market is not looking strong. Regardless of the direction of BTC, the BTC dominance is expected to go up, and altcoins won't perform well against BTC.

MATICBTC 1DSupports for MATIC/BTC are at 0.00002231 and 0.00001913. These are the levels at which there has been a significant amount of buying in the past, providing a kind of "safety net" for the price.
Resistances are situated at 0.00002867 and 0.00003003. These are the levels at which sellers have historically entered the market and prevented price appreciation.
An important additional observation is the breakout of the bearish channel. This is often seen as a bullish signal, indicating that the downtrend may be over and a new uptrend may be starting.
Fundamental Analysis of the MATIC/BTC pair:
Polygon (MATIC) is a Layer 2 solution for Ethereum that aims to improve its scalability and speed. It has seen rapid growth and adoption because of Ethereum's gas fee and transaction speed issues.
MATIC offers a solution to these problems and has a growing list of projects choosing to build on it, which adds to its strong foundation. However, its valuation against Bitcoin will depend on the market's perception of its technological progress and the general demand for scalability solutions.
In conclusion, technical analysis suggests bullish potential due to the breakout of the bearish channel, although the RSI suggests that the market may be overbought. MATIC's fundamentals are solid, with many projects choosing to build on top of Polygon, indicating that it could be a good option for long-term holding. However, it is important to conduct your own research and consult a financial professional before making any investment decisions.

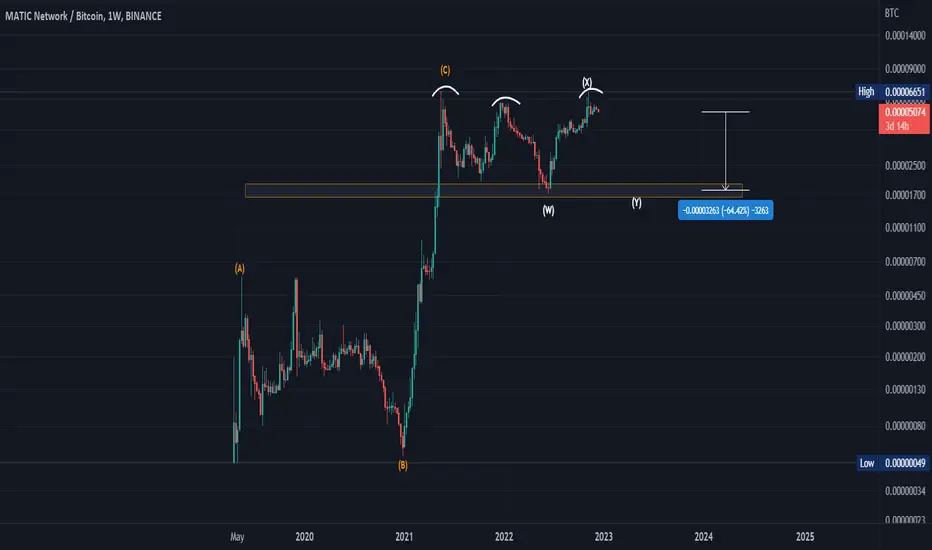
Is MATIC Ready for 60% Downside Move As per ChartTechnical Chart Analysis of MATIC/BTC - Bear and Bull Market Insights
Market Overview:
MATIC is currently trading at 0.00002163 BTC, representing a significant decline of 65% from its all-time high. While the technical analysis suggests a bullish scenario due to the formation of a bull flag on the MATIC/BTC weekly chart, market sentiment does not support an upward move for MATIC at present.
Key Analysis Points:
Bull Flag Formation: The MATIC/BTC weekly chart indicates the formation of a bull flag pattern, which traditionally signals a potential bullish trend.
Market Sentiment: Despite the bullish chart pattern, current market sentiment does not align with an upward movement for MATIC.
Support Levels: The immediate support level for the bull flag pattern is at 0.00002100 BTC. A price drop below this level would confirm strong bearishness.
Target After Breakout: If hold Current Support then, the target for MATIC/BTC is projected to be 0.00000600 BTC, which represents a substantial decline of 60-70% from the current level.
Worst-Case Scenario: In the event that MATIC/BTC holds the current support level at 0.00002100 BTC, there could be a bounce towards 0.000036 BTC or even 0.000057 BTC before the anticipated downward movement.
Key Levels:
Support Levels: Significant support levels to monitor are at 0.000021 BTC and 0.000006 BTC.
Resistance Levels: Key resistance levels to watch are at 0.000036 BTC and 0.000060 BTC.
Disclaimer:
This analysis is not financial advice. It represents the personal opinion and analysis of the author. Individuals considering investments in any coins, including MATIC, should perform their own research and consult with financial professionals.
Follow us for More Chart Analysis.

MATICBTCA double bottom or double bottom pattern at the end of a descending angle pattern indicates a temporary uptrend
Of course, we must allow the upcoming resistance to be broken at 0.0000339

Its a type of MATIC!Hi Guys,
Very simple chart
Get a position and hold. If we fall below the lower boundary of the ascending triangle your get out of the trade.
This is another good risk to reward trade.
MATIC/USD chart will be shared later today, this is also leaning bullish.
MATIC is one of thee very few altcoins that have kept up with BTC in terms of value.
PUKA

#MATIC/BTC - Long - Potential 3.08%Direction: Long
Market: Spot
Risk: 0.25% - 1%
#BTC_MATIC
Exchange: BINANCE
Timeframe: 360
TP1: 0.00003547
Entry: 0.00003443
STOP: 0.00003339
Entry Conditions;
| Long-term trend break
| Volume confirmed
| CDV break

MATICBTC just got this chart, taking a close lookI just got this chart and I'm taking a quick look. Look for it to jump out of where it is lol.

Polygon (MATIC) ATH !Polygon price today is $1 with a 24 hour trading volume of 2.6 Billion dollar. MATIC price is up 17% in the worst days of crypto market
bear market is the best time to build and Matic team used this opportunity splendidly, they partnered with Nubank, Meta, Reddit and other good banks and companies
now on btc pair we back to ATH again and usd pair hold its up trend . if you managed to buy it at 0.00002 its time to take some profit and have some fun and If you waiting for scalp then we still need to break 0.000066. right now Matic do a healthy correction and if BTC recover we ready for new ATH
what do think about Matic chart?

🔥 MATIC/BTC Near All-Time Highs: Great Long-Term OutlookMATIC has been one of my favorite alts of the last bull-cycle. It was also one of the majors gainers back then.
Interestingly enough, MATIC/BTC is currently closing in fast on its all-time high value. Which is, in my view, an incredible bullish thing. This indicates that, even when the market is bad, investors are still placing a lot of trust in this token, equally much as in May of 2021!
Personally, I think we're currently trading in a huge bull-flag, only waiting to break out. Once we break out, I'm looking for a MATIC/BTC value of 10,000 and 8,000 (omitted the zero's).
I'm confident that the next cycle will be great for MATIC.

MATICBTC Long-term Ascending Triangle shows Matic break-outThe MATICBTC pair has been trading inside an Ascending Triangle since July 2022 with the 1W MA50 (red trend-line) supporting. The Fibonacci Channel levels show that as the 1D RSI is approaching its Lower Highs (Bearish Divergence against the Higher Lows of the Ascending Triangle), we could see a pull-back. This is highly possible within a 0.00005800 - 0.00006650 Resistance Zone that is holding since May 19 2021.
Likely to see ascending trading within Fib 0.236 - 0.618 until Resistance 2 breaks. The top of the Ascending Triangle break-out should be within the 1.618 Channel Fib and the 2.0 horizontal Fib extensions. In our view above 0.0001100.
-------------------------------------------------------------------------------
** Please LIKE 👍, FOLLOW ✅, SHARE 🙌 and COMMENT ✍ if you enjoy this idea! Also share your ideas and charts in the comments section below! **
-------------------------------------------------------------------------------
💸💸💸💸💸💸
👇 👇 👇 👇 👇 👇
