Polygon: Holy Poly Guacamole 🥑Let's show 'em how it's done! Polygon continues to spike up and should exceed the resistance line at $1.30, if it carries on with its bullish temper. Our alternative scenario implies, that MATIC could drop below the support line at $0.689 until it reaches the end of the blue wave alt. (ii).
MATICBULLUSD trade ideas

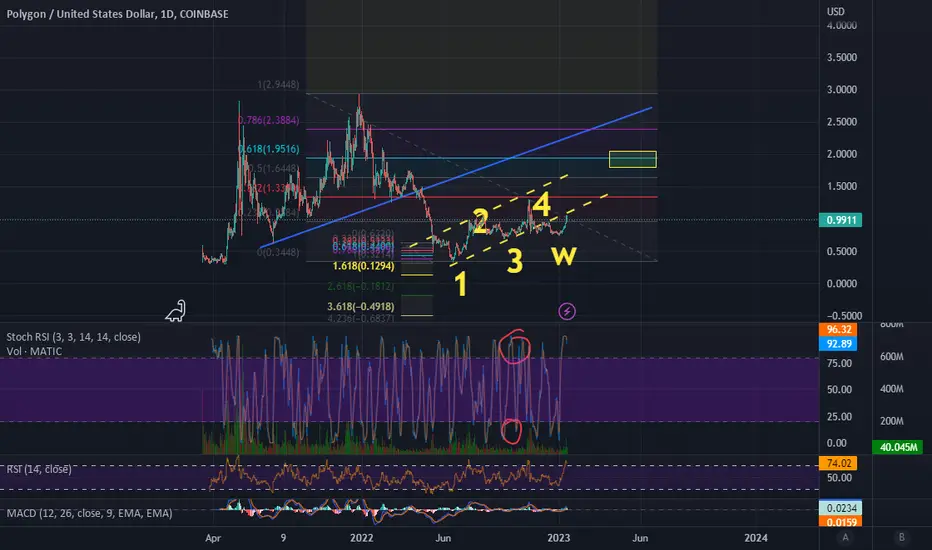
$MATIC has held up well and may be poised for more gains$MATIC has held up well over the summer of 2022 while the rest of crypto fell.
Here are 2 possible counts I'm considering that imply another rally. The first is a triangle pattern (black labels) and the second is a w-x-y combo (blue).
If its the triangle, this rally is wave (d), then a brief setback in wave (e) that leads to a powerful rally.
If its the combo, then the rally may have already started.
There is a bearish count (not shown) that is active so long as MATIC holds below the black horizontal line.

MATIC Breakin Trend lead us 0,45 0,22 AreaMATIC Breakin Trend lead us 0,45 0,27 Area
MATIC Retrace will break the line till 0,45 0,22 target

Matic update #BarendsCryptoThis is an update to my Matic chart, likely this project will the price i set months ago.
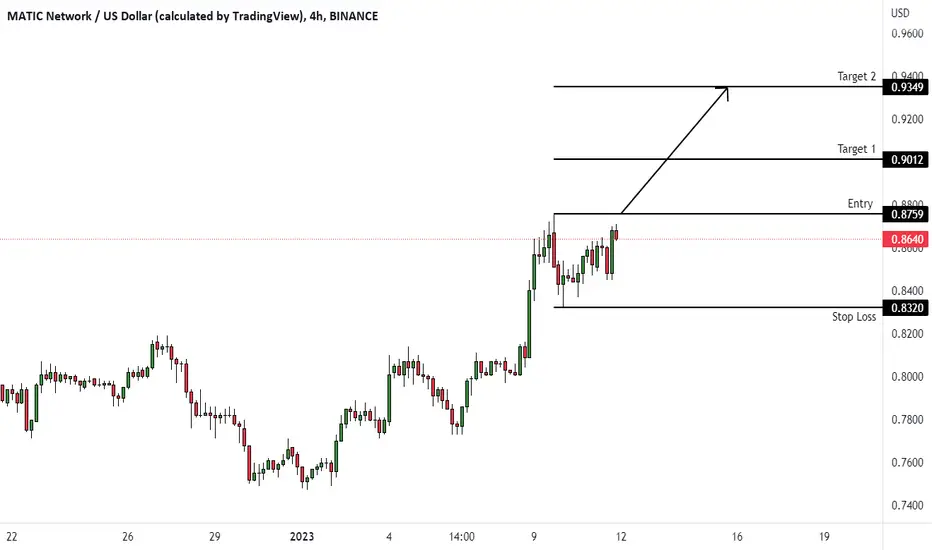
MATICUSD (4H) - Bullish breakoutHi Traders
MATICUSD (4H Timeframe)
The market is in an uptrend and we are waiting for an entry signal to go LONG above the 0.876 resistance level. Only the downward break of 0.832 would cancel the bullish scenario.
Trade details
Entry: 0.876
Stop loss: 0.832
Take profit 1: 0.901
Take profit 2: 0.935
Score: 7
Strategy: Bullish breakout
Polygon #MATIC updatePolygon (previously Matic Network) is the first well-structured, easy-to-use platform for Ethereum scaling and infrastructure development. Its core component is Polygon SDK, a modular, flexible framework that supports building multiple types of applications.

MATIC LongJust entered a long MATIC trade. Regaining the MA200 is a big deal, especially with MATIC, and is one of few tokens right now that has a long confirmation.

MATICUSD (Polygon) ZonesHere we are looking at MATICUSD on the Daily TF…
Let’s begin by zooming out on the chart to get a sense of the important zones that we must consider when analyzing Polygon in its local price range.
When looking for Macro support, the strongest support line that we can draw rests at approximately $0.31 as marked by the bottom (green) line.
In the immediate short term, we are looking at local support at about $0.75, so there is quite a lot of space between our local and macro support lines. If MATIC can’t hold its local support line (green), then we may expect a fall to its bear market lows, which also happen to be its macro support at $0.31.
Lastly, let’s quickly analyze the resistance range drawn on the chart. This resistance zone ranges from $1.00-$1.30.
As it continues to bounce between local support and resistance, we will keep you posted on relevant developments in the chart…
Cheers!

MATICUSD H8: +20% gains BULLS the BEST level TO BUY/HOLD(SL/TP)Why get subbed to me on Tradingview?
-TOP author on TradingView
-2000+ ideas published
-15+ years experience in markets
-Professional chart break downs
-Supply/Demand Zones
-TD9 counts / combo review
-Key S/R levels
-No junk on my charts
-Frequent updates
-Covering FX/crypto/US stocks
-before/after analysis
-24/7 uptime so constant updates
🎁Please hit the like button and
🎁Leave a comment to support our team!
MATICUSD H8: +20% gains BULLS the BEST level TO BUY/HOLD(SL/TP)
IMPORTANT NOTE: speculative setup. do your own
due dill. use STOP LOSS. don't overleverage.
READ ENTIRE IDEA BEFORE EXECUTION!
🔸 Summary and potential trade setup
::: MATICUSD H8/candle chart review
::: strong / bounce reversal 75 cents
::: bulls maintain control expect more gains
::: trading within well-defined range / accumulation
::: setup still valid as of RIGHT NOW
::: chart is LOG SCALE
::: 15-20% upside remains
::: BULLS focus on buying dips
::: BUY LOW after pullback is over
::: entry - after dips/pullback
::: TP1 bulls 92/94 cents
::: use tight stop loss for this trade
::: 1.00 mirror S/R resistance overhead
::: potential re-test of mirror S/R at 1.00 USD
::: bounce in progress / focus on buying dips
::: reversed via minor IHS setup on 1 hour TF
::: SPECULATIVE SETUP
::: do your own due dill
::: and use proper risk management
::: TP bulls is +20% gains
::: details: see chart
::: FINAL TP is +20% gains 1.00 USD
::: recommended strategy: BUY/HOLD after correction
::: TP BULLS +20% gains 1.00 USD final TP
::: SWING TRADE: BUY/HOLD IT
::: bull run not over yet
::: good luck traders!
::: BUY/HOLD and get paid. period.
🔸 Supply/Demand Zones
::: 72/74 cents demand
::: 1.00 usd fresh supply zone
🔸 Other noteworthy technicals/fundies
::: TD9 /Combo update: N/A
::: Sentiment mid-term: BULLS/20% gains
::: Sentiment short-term: DIPS PULLBACK/MODE
RISK DISCLAIMER:
Trading Crypto, Futures , Forex, CFDs and Stocks involves a risk of loss.
Please consider carefully if such trading is appropriate for you.
Past performance is not indicative of future results.
Always limit your leverage and use tight stop loss.

Matic 1h chartthis is why we say all of the market is like a chain that BTC is they of the chain.
Matic chart is realy like the btc chart and its going to behave like BTC
if you want to take get short please be carefull and pay attention to your stop loss.
Follow for more and say your comment below the post

MTCUSD Cryptocurrency | Pivot Point | Channel Confirmations:
R1 (0.804); Channel Resistance; P (0.819); Horizontal Resistance

upper and lower bound range. LongSame model. Optimized pretty well now. As you can tell from the previous trades were starting to get a really good edge.

$MATIC has been old faithful for some time nowOf course $BNB is the mover :D
$MATIC still looks healthy - There is the issue of LONG TERM moving Avgs coming up
$XRP not moving but this has tendency to pop out of nowhere, really like that reversal
$DOGE outperforming $SHIB, IMO good call
#Crypto

MATICUSD H16: +40% gains BULLS the BEST level TO BUY/HOLDWhy get subbed to me on Tradingview?
-TOP author on TradingView
-2000+ ideas published
-15+ years experience in markets
-Professional chart break downs
-Supply/Demand Zones
-TD9 counts / combo review
-Key S/R levels
-No junk on my charts
-Frequent updates
-Covering FX/crypto/US stocks
-before/after analysis
-24/7 uptime so constant updates
🎁Please hit the like button and
🎁Leave a comment to support our team!
MATICUSD H16: +40% gains BULLS the BEST level TO BUY/HOLD(SL/TP)
IMPORTANT NOTE: speculative setup. do your own
due dill. use STOP LOSS. don't overleverage.
READ ENTIRE IDEA BEFORE EXECUTION!
🔸 Summary and potential trade setup
::: MATICUSD H16/candle chart review
::: accumulation in progress
::: bulls maintain control expect more gains
::: trading within well-defined range / accumulation
::: setup still valid as of RIGHT NOW
::: chart is LOG SCALE
::: get ready to BUY LOW later near range lows
::: currently/soon CORRECTION MODE
::: BUY LOW after pullback is over
::: entry - NEAR 72/74 CENTS
::: for now PULLBACK/CORRECTION MODE
::: use tight stop loss for this trade
::: 1.00 mirror S/R resistance overhead
::: potential re-test of mirror S/R at 1.00 USD
::: 72-74 cents decent bounce zone BULLS
::: potential HS setup BULLS bounce play
::: SPECULATIVE SETUP
::: do your own due dill
::: and use proper risk management
::: TP bulls is +40% gains
::: details: see chart
::: FINAL TP is +40% gains 1.00 USD
::: recommended strategy: BUY/HOLD after correction
::: TP BULLS +40% gains 1.00 USD final TP
::: SWING TRADE: BUY/HOLD IT
::: bull run not over yet
::: good luck traders!
::: BUY/HOLD and get paid. period.
🔸 Supply/Demand Zones
::: 72/74 cents demand
::: 1.00 usd fresh supply zone
🔸 Other noteworthy technicals/fundies
::: TD9 /Combo update: N/A
::: Sentiment mid-term: BULLS/40% gains
::: Sentiment short-term: CORRECTION/MODE
RISK DISCLAIMER:
Trading Crypto, Futures , Forex, CFDs and Stocks involves a risk of loss.
Please consider carefully if such trading is appropriate for you.
Past performance is not indicative of future results.
Always limit your leverage and use tight stop loss.

MTCUSD Target Price 0.8191Expect MTCUSD to reach price level 0.8191. I am targeting the top of parallel channel for take profit.

$MATIC still trading mid-70s to mid-90sAs the title states, matic has been trading between the mid 70s to the mid 90s. It had a brake lower one time and it had that huge pump a while ago above the '90s.
If you put $matic on a longer term time frame you will see why up move stopped.
Using daily is great for short-term pumps but if you use the longer-term charts, you'll see where the up swing will likely stop.
Once you see that the longer-term charts are no longer negative that's when you know we should keep pumping and daily charts will help you with resistance levels higher up and trading portions of them but this is when you begin to hodl. This is a process that takes a long time, especially if they are monthly charts.

Shiba & Doge & ADA & Matic Signals Signals for Shiba, Doge, ADA, and Matic.
Live Broadcast for educational purposes only.
Please enjoy and engage with one another.

Matic target range 0,4 to 0,21 SharkMatic target range 0,4 to 0,21 Shark pattern area.
Matic downtrend has a target area with Shark pattern.

Matic (Polygon) Gem EditionPolygon believes in Web3 for all. Polygon is a decentralised Ethereum scaling platform that enables developers to build scalable user-friendly dApps with low transaction fees without ever sacrificing on security.
#Instagram launches NFTs on Polygon
#arrow-rightStripe launches global payouts with crypto using Polygon
Sadly correction is needed!

MATIC potential Buy and Sell DatesIf this pattern of Money flow repeats, potential Buy and Sell Dates are clear

Polygon MA200Interesting tests of the MA200 by MATIC. Watch to see which way it'll break, but looking back at the chart, the MA200 is like a magnet.

MATIC on a Head and Shoulders trying to avoid disasterThe Matic Network (MATICUSD) recently established trading below its 1D MA200 (orange trend-line), closing a daily candle below it for the first time since October 20. This alone is far from ideal for buyers but the price remains within the wide 0.690 - 0.770 Support Zone that is holding since July 26.
However, we can't ignore the Head and Shoulders pattern since October 13 that has just been completed. If broken to the downside, this has the potential to drop as low as the 1.5 Fibonacci extension, which is at 0.380 with potential Support levels before that at 0.525 and 0.420.
Until the Green Zone breaks though, the price can potentially rebound back to the 1D MA50 (blue trend-line) and the 0.970 overhead Resistance. The 1D ADX indicator seems to be in agreement. A closing above the 0.5 Fib at 1.000, invalidates the Head and Shoulders pattern completely and recovers the price towards 1.300.
-------------------------------------------------------------------------------
** Please LIKE 👍, SUBSCRIBE ✅, SHARE 🙌 and COMMENT ✍ if you enjoy this idea! Also share your ideas and charts in the comments section below! This is best way to keep it relevant, support me, keep the content here free and allow the idea to reach as many people as possible. **
-------------------------------------------------------------------------------
You may also TELL ME 🙋♀️🙋♂️ in the comments section which symbol you want me to analyze next and on which time-frame. The one with the most posts will be published tomorrow! 👏🎁
-------------------------------------------------------------------------------
💸💸💸💸💸💸
👇 👇 👇 👇 👇 👇

Liverpool x MATICshocker here, as soon as Liverpool sign a partnership with MATIC, the crypto suffers and 80% drop in asset value. that's what happens when you partner with a broken company owned by LeBron.
