Polygon (MATIC) x Total volume traded on UniswapAs per the bearish divergence from February 2021 to May 2021, this indicator has early signaled the top.
Now the traded volume is about to exit a bearish channel.
We also have an expansion wedge that is about to be broken along with the 50% retracement.
MATICBULLUSD trade ideas

Matic going down to the topMatic will go up to 0.8973 low to 0.855 and then 0.835 to continue down to its limit 0.72

Matic will lower to its top
Will drop again to 0.855 and continue to drop to its limit at 0.72 and then take off to 0.993

Matic goes down to his limitMatic will go down to 0.893 it will be its limit and then it will start to go down further to 0.72 and there we will go long

MATIC is not done yetMATIC is holding support at 0.93 which is the daily 0.236 fib retracement from recent high to low. Touched and help support on 4H lower Bollinger band
Once that yellow trendline is clear, MATIC should see another quick test to $1. Then the show begins... S/R flip of $1 will propel MATIC to $1.18 quickly with my main target of $1.30
Good Luck

MATICUSD Short PositionIf the price breaks the neckline, the minimum price target of the pattern will be 0.56. In this manner, the pattern on the chart may provide an opportunity to short MATICUSD for a profit of 26.39%.

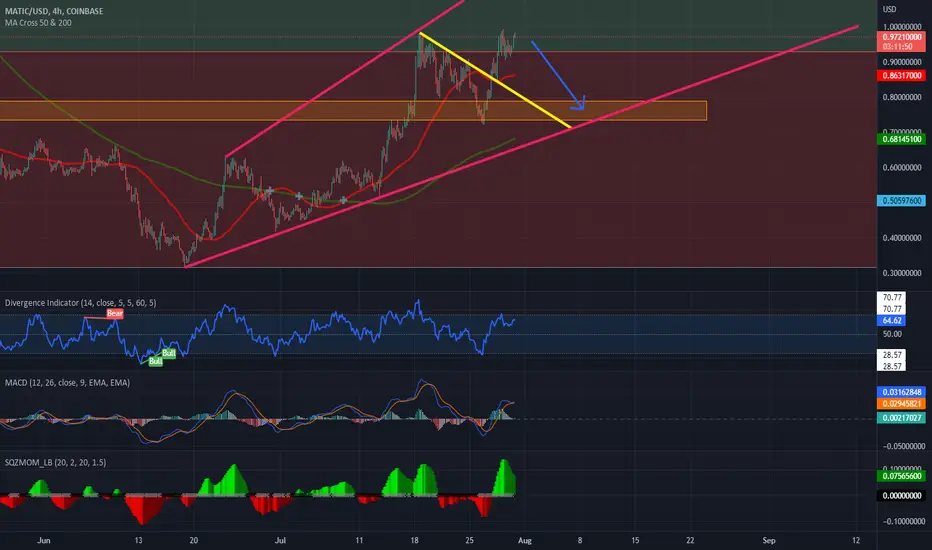
MATIC Pullback?Look for MATIC to pull back to the orange box.
I have a target of $0.80 down to $0.73
Entered: $0.975
Stop Loss: $1
Good Luck
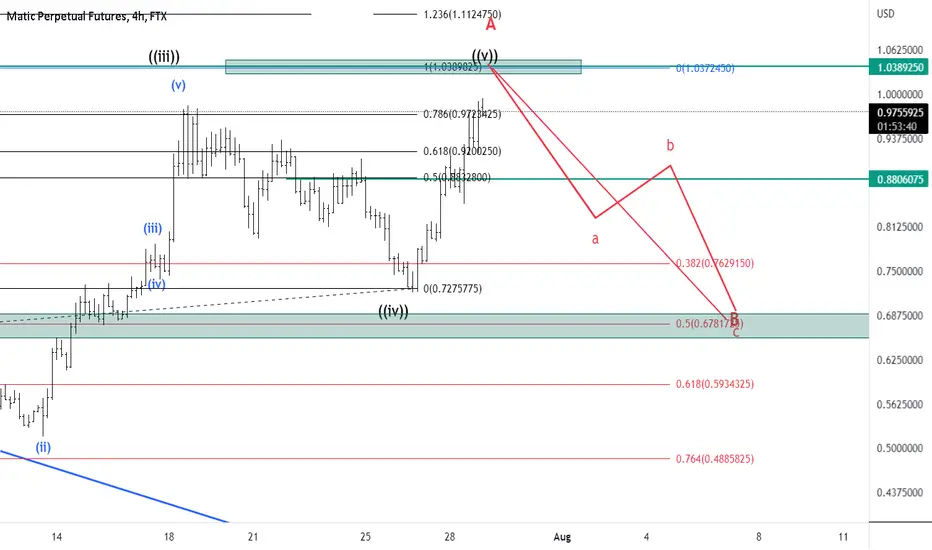
MATIC/USDT Elliott Wave countMatic may end soon this impulse to the upside that probably is an A wave.
Also we have a broken resistance that can be retested at 0.5 fib retracement if this A will end at 1.039 usd
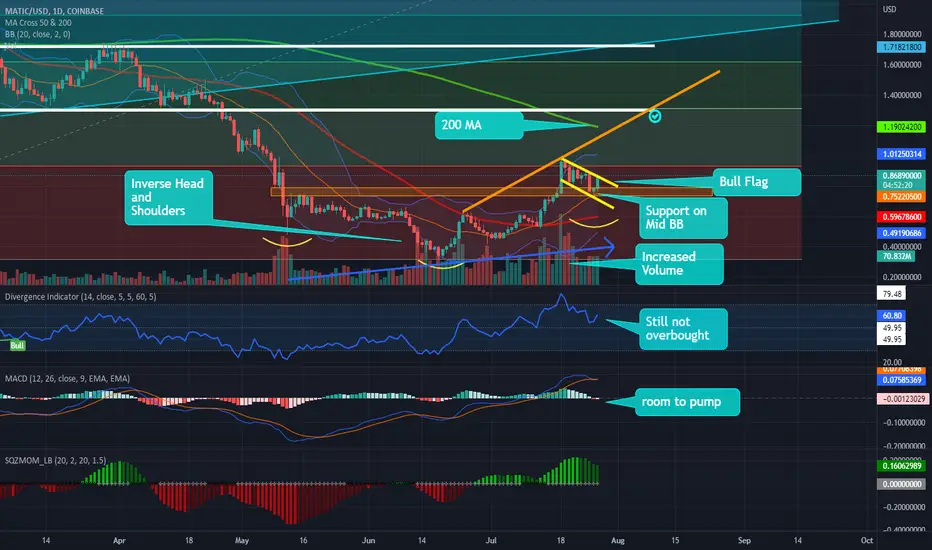
MATIC Bull Speed Ahead!Many items listed on this chart show bullish direction.
My target is above the 200MA up to completing the inverse head and shoulders pattern:
$1.18 - $1.30
Need to confirm exit of Bull Flag. Daily close above would initiate exit.
Send IT and Good Luck
MATICUSD ❕ an asset can exit from the downward channelVolumes show interest in price rising.
Price has tested and fixed above the 100MA (4H TF)
The asset has entered a bullish RSI zone (4H TF)
TD Sequential has formed an up reversal signal (4H TF)
I expect that MATIC may start rising if it gets out of the downward channel and fixes above the resistance level.

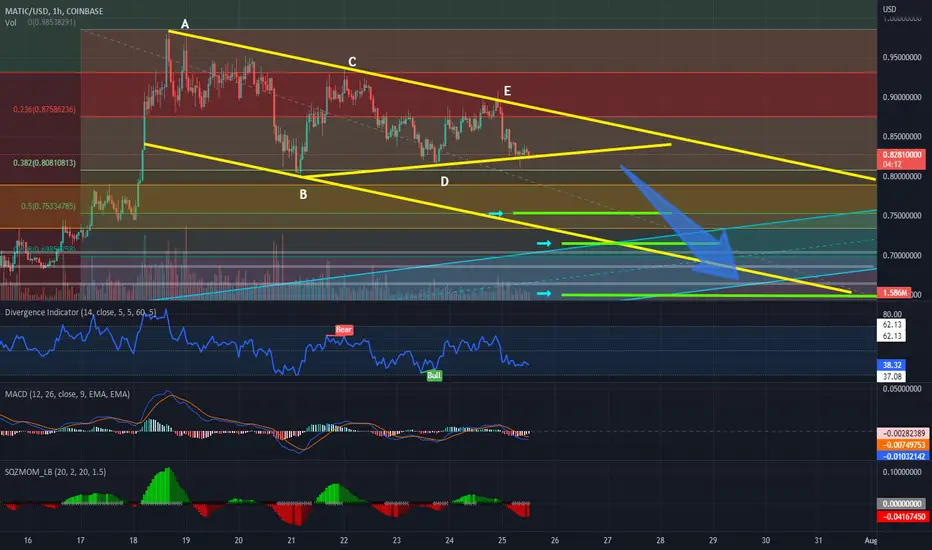
MATIC Triangle breakdownMATIC is consolidating in a triangle after making lower highs.
Monitor for a breakdown of the triangle support. 1 hour candle close below support and a retest rejection should indicate lower levels.
Short Targets are:
$0.75 (50% retrace from recent low to high)
if further breakdown...
$0.71
$0.65
Good Luck
Continue to fall
matic has been broken
It's going to keep going down here
I have told you to sell before
Follow me to take you to achieve financial freedom

Is the Matic Crypto a scam ? Polygon MATIC scams have skyrocketed in recent months. While some few wise people believe that Polygon MATIC is a scam, the reality is exactly the same. there have been instances of people in the Polygon MATIC industry who have exploited innocent investors. While it's true that there are scams, a Polygon MATIC is a scam because the perpetrator is taking advantage of innocent investors.
A common sign of an Polygon MATIC investment scam is guaranteed high returns. It is important to educate yourself on how to properly invest your money. If the offer sounds too good to be true, it probably is.
Note: EVERYBODY! RUN AWAY! its a scam


Continue to be bearish on MATICmatic has peaked
This position is likely to form a double top
I suggest you to bounce back and sell
Follow me to take you to achieve financial freedom

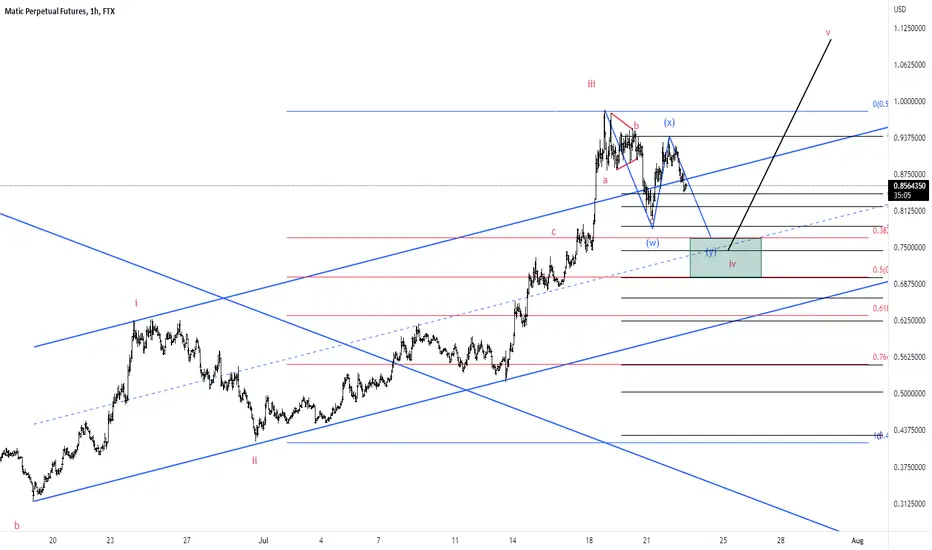
MATIC/USDT Elliott Wave countMatic probably is into an impulse to the upside and now we are into a WXY 4th wave. Expecting to bounce at 0.700-0.750
Continue to be bearish on MATICMATIC has broken in four hours
It's a rebound after a breakout
Not expected to break above previous high
I suggest you continue to sell on rallies
Follow me to take you to achieve financial freedom

$MATIC #polygon breakout$MATIC Breakout in 1h Chart
1. Positive Super Trend in 4h Chart & Consolidation > 8 days
2. Several touching points with vwap
3. Price above 10, 20 & 50 EMA
4. Target 1.26$
5. Stop-Loss 0.85$
6. Risk Reward Ratio 4.7

MATIC breaks down
MATIC's four-hour structure has broken out
There is a risk of a short-term pullback
I suggest you sell on rallies
Follow me to take you to achieve financial freedom

MATIC Cup with a handle going to 1$Cup&Handle forming on daily while we have broken above trendline. A retest of the trendline and a bounce would trigger a good long opportunity, targeting 1$ area for take profit

MATICUSD ❕ volatility decreasesMATIC showed one of the highest growth rates among the top 100 coins.
Volatility is declining.
I expect the current move could be a reversal for a local correction, so I think the price will decline after consolidating below the support level.

Polygon (MATIC) - $0.60 - $0.65 will be great supportPolygon - $0.60 - $0.65 will be great support - IMO
After the breakout MATIC will have to correct before trying to break the resistance trendline since ATH December 2021
This break would be a HUGE bullish signal - but conformation has to occur for more accuracy dear Crypto Nation
*not financial advice
do your own research before investing

Polygon (MATIC) shoots. WHY?Polygon Network's location action has gotten quickly which has given areas of strength for a to the MATCI cost.
Polygon prime supporter Mihailo Bjelic has put anticipation expressing that they will declare the most-significant uncover of 2022 of every 3 days.
Ethereum's Layer-2 versatility stage Polygon has been doing great. Polygon's local digital money MATIC has been the top entertainer in the altcoin space mobilizing in excess of 60% over the course of the past week.
As of press time, MATIC is exchanging 15% up at a cost of $0.90 and looking at a quick objective of $1.0. With the new cost siphon, MATIC has additionally stretched out its month to month acquires near 150%.
The MATIC cost soar as Disney picked Polygon for its Accelerator Program a month ago. The program will zero in on expanded reality (AR), man-made reasoning (AI) characters, and non-fungible tokens (NFTs). In any case, the job of Polygon isn't clear for the time being as Disney will give further direction later on. However, the actual news appeared to have carried more prominent cheer to financial backers.
Ethereum's Layer-2 versatility arrangement has been dealing with a few key improvements as of late. While MATIC confronted the intensity of the crypto market implosion last quarter, it has additionally returned rapidly. Moreover, market experts have been extending hopeful conjectures for MATIC which has prompted more noteworthy financial backer certainty.
Accordingly, MATIC is riding the most grounded wave among other altcoins during this market recuperation. Then again, Polygon has been exploiting a portion of the new occasions on the lookout.
The breakdown of the Terra biological system left a few decent quality undertakings in a condition of vulnerability. This is where Polygon uncovered another asset to help Terra-put together undertakings relocate with respect to the Polygon blockchain network. Up to this point in excess of 48 Terra projects have effectively relocated to the Polygon blockchain network.
Then again, the quantity of decentralized finance (DeFi) conventions on Polygon is likewise expanding. Thus, the interest for MATIC tokens is all the while expanding. The absolute worth locked (TVL) across all DeFi conventions on Polygon at present stands at $176 billion.
