MATIC2 Scenarios for MATIC
Do not go all in, Always try to apply cost averaging strategy.
Not Financial Advise
MATICBULLUSD trade ideas

MATIC - BROKE SUPPORT AND HORIZONTAL TRIANGLE! So, What's Next?Happy Icy Texas Friday, Traders!
Hope you find value from this post.
If you did, pls like and consider following.
Here's a trading idea.
But firstly...
==============================
Quick Disclaimer:
Trade at your own risk. This post/chart is for your reference only, it is not intended as a recommendation, nor is it an advice to sell nor buy this crypto asset, nor to place any trade.
Trading poses a risk of losing some or all of your money and it will be your responsibility if you lose money.
I am not trading this asset but TA on this asset has been requested, so it is my pleasure to present my views on this GALA/USD pair.
==============================
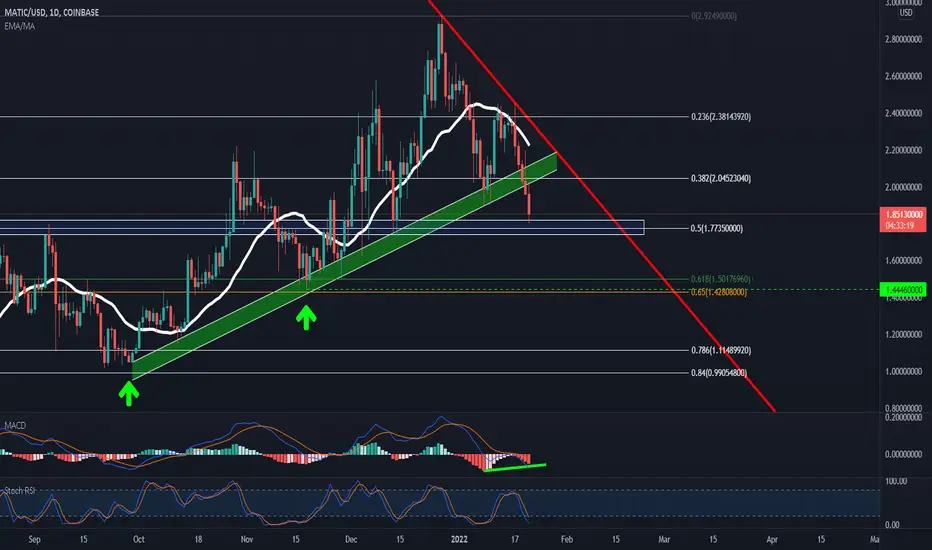
MATIC remains its Bullish disposition as price has stay way above $1.4446
MATIC broke out of its Green Ascending Support Bar and has reached key support at the Blue Horizontal Bar.
What is now happening?
Then next move for MATIC could be a continuation of this bearish move to reach the 50% Fib at $1.7735
If MATIC breaks that key support, the next level below is the 61.8% Fib at $1.50176
After being rejected at the Red Resistance Trend Line and its 21MA, GALA has dipped down towards the support lines, and the support bar.
Another probably move for MATIC now is to crawl sideways (consolidate) along the Blue Horizontal Bar to potentially create a Descending Triangle (bearish).
What if MATIC bounces from here?
The 21MA and the Resistance Trend Line above could continue keeping MATIC down.
So, unless MATIC breaks out of the resistance trend line above and stay above its 21MA or even the 50MA, a conservative trader would not enter a long position.
MACD: The histogram has a bullish divergence, although there isn't one on the signal lines.
Stoch RSI: Stoch RSI on this chart is at the Oversold Region and no bullish crossover.
Price action is KING!
Always remember to place your Stop Loss.
Patience and Discipline are KEYS to a successful trade.
Trading is both a Science and an Art.
Develop an intuition and listen to your instinct while following the rules putting emotions aside.
If you have not yet developed it, you will develop this as long as you stay consistent with following
the rules. The skills will become second nature to you much like how you acquire the skill in riding a bicycle.
Soon it will be your subconscious running your trades, again, much like when riding a bicycle
the balancing is controlled by the subconscious part of your brain.
Be PERSISTENT and stay PERSISTENT.
Let me know what asset you wish for me to look at and evaluate for potential long set ups and I will post it here on TradingView.
If you found value from this post, consider giving it a like and subscribe. Furthermore, share it with someone you know will benefit from this.
More power to all your trades, my friends!
Ron
Intrepid_Trader
Fib levels below:
1.136 = $35,601
1.272 = $31,603
1.382 = $28,369
$Matic getting bullish.Matic is all set to achieve new ATHs. I am expecting Matic will hit 3 new price levels by the end of the bull run. Go Matic Go

$MATIC SHORT N LONG$MATIC has just broadcasted the ceiling of the next swing move. Short for $1.75 (previous swing low), then switch long for $2.17 resistance.

MATICThe Red is a much more plausible outcome right now given BTCs movements.
The black trend may not be the place where matic falls to as there are only 2 data points, but it is just a start.
The entire market is showing significant bear signs so prepare yourselves for a potential bear 2022.

MATIC back to the price where it all started?Looking at the linear regression channel we might fall back to the inception of the last ATH.

MATIC - RISING WEDGE TO DOWNSIDE - $1.20 IMMINENTmatic breaking down like everything else, looking for a downside target from where the wedge started at around $1.20
stay safe and have patience
not trading advice
tg

1.19.22 MATIC Ive been experimenting with the strategy of going long and short at the same time, in a way.
I know theres a name for this strategy but im forgetting it at the moment.
Anyway this strategy has been very successful for me so I am trying to document it more because I've been opening a lot of trades at the same time and its becoming hard to keep track of them all.
BTC dumped but is still showing a little strength for a bounce.
The DXY is pulling back a bit and SPX is still selling off.
I feel very soon crypto will get a big rally.
MATIC looks decent enough to take a shot at it. very low leverage (2x) and tight stop.
Theres a harmonic pattern too on the 4hr.
So in a sense we are playing both sides as you should when trading because the market is always moving in both directions. You're going to lose money no matter what so the best option is to mitigate losses. Ideally you're building up small amounts of profits over time.
We long support and short resistance. BUT ALWAYS with an edge.
There are two short positions there because I will add to my positions there. If the trend breaks resistance I will cut my shorts and ride the profits of my longs.

MATIC USD : Head and Shoulder's Pattern 1D TimeframeMy warm greetings to everyone
Nice to meet everyone who is looking for These Ideas. I will be glad to hear your opinion about this.
MATIC fell down from his last max $2.9 to $2. The Trend Line is near $2 and there are head and shoulder's pattern on 1D timeframe
If it drop under the $2 support zone and find its place under of it, we will see MATIC at $175 and even at $150.
SELL at $1.9
TP1 50% at $175
TP2 50% at $150
SL at $2.2
Be sure to use stop loss in your positions.
This is an article, not financial advice, always do your own research.
If you have any questions, you can write it in comments below, and I will answer them.
And please don't forget to support this idea with your like and comment, thank you.

MATICUSD D1: DISTRIBUTION / 50% correction(SL/TP)(UPDATE)Why get subbed to me on Tradingview?
-TOP author on TradingView
-2000+ ideas published
-15+ years experience in markets
-Professional chart break downs
-Supply/Demand Zones
-TD9 counts / combo review
-Key S/R levels
-No junk on my charts
-Frequent updates
-Covering FX/crypto/US stocks
-before/after analysis
-24/7 uptime so constant updates
🎁Please hit the like button and
🎁Leave a comment to support our team!
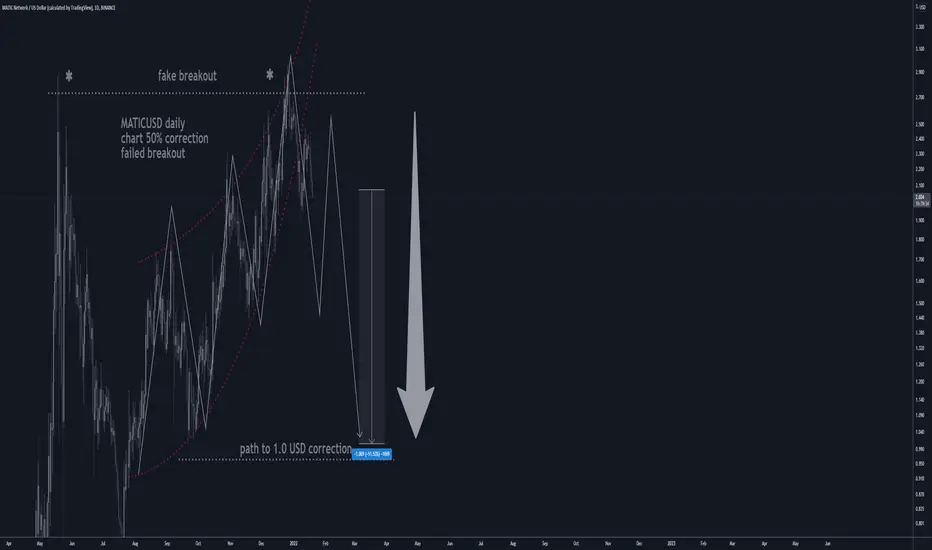
MATICUSD D1: DISTRIBUTION / 50% correction(SL/TP)(UPDATE)
IMPORTANT NOTE: speculative setup. do your own
due dill. use STOP LOSS. don't overleverage.
NOT a setup to SHORT MATICUSD . Just showing
signs of weakness and recommend to stay out
of this market into the pullback.
🔸 Summary and potential trade setup
::: MATICUSD D1 chart review
::: not a great looking chart
::: hit top / resistance of the bullish channel
::: also noteworthy divergence
::: price/ RSI div very clear on D1/H8 TF
::: distribution price fractal
::: re-test of bullish TL (yellow)
::: expecting correction/pullback mode
::: pullback required to attract
::: new buyers from the lows
::: 30-40% pullback possible next
::: 4-8 weeks in Q4 2021 / Q1 2022
::: right now limited upside
::: positions traders should wait for
::: better entry prices later after
::: correction MODE up next
::: be careful don't get caught up in this
::: also overextended right now
::: BULLS remain on sidelines and
::: be ready to BUY LOW later
::: recommended strategy: SHORT SELL RIPS/RALLIED
::: TP BEARS is +40% gains
::: BULLS stay out until correction is over
::: BULL seek to reload near 1.0 USD
::: 1.0 USD strong / horizontal S/R level
::: SWING TRADE: SHORT/HOLD IT
::: correction run not over yet
::: good luck traders!
::: BUY and get paid. period.
🔸 Supply/Demand Zones
::: N/A
::: N/A
🔸 Other noteworthy technicals/fundies
::: TD9 /Combo update: N/A
::: Sentiment mid-term: BEARS/CORRECTION
::: Sentiment short-term: BEARS/CORRECTION
RISK DISCLAIMER:
Trading Crypto, Futures , Forex, CFDs and Stocks involves a risk of loss.
Please consider carefully if such trading is appropriate for you.
Past performance is not indicative of future results.
Always limit your leverage and use tight stop loss.
Matic Broke Major Daily Support LineMatic broke a very important support line, it will probably die a lot from here.
Long term short hold.....

MATIC 2nd Head & Shoulders Pattern???Chart is self explanatory. Regression Trend set at 2 Stan Dev. I am short for trading but long for investment. I currently don't see the major H&S playing out unless the entire crypto market shytes the bed. The first one worked like a charm. Loved how this has held up, relative to the alt coin spectrum, over the past month but seems to be losing it's staying power over the past week or so. I have the same feeling on ATOM. Good luck and I don't know SH_T about F_ _K so this is not investment advice. peace.

MATIC long term upside with short term fallCould this be a good setup?
Technical analysis says yes.
Long term price is most likely going up despite of this correction in the short term.
1.50$ per MATIC would be the perfect re-entry point.

Possible Head and ShouldersMatic has been ranging well, but a head and shoulders could be a problem at the diagonal support. It really could go either way once price gets back to support. Just something to pay attention to and act accordingly when/if the time comes.

MATIC 1$ ? : Be careful of this pattern Rising wedge + The bear power + Rsi still able to go lower on week TF (see the binance chart this is FTX :))
= More dump
Expect the unexpected. dont underestimate the bear power :P
Feel free to feedback / comment
Trade safe.. always place ur stop loss
Mil

matic/usd Double Top ? nahhhHi Folks,
Looks a little like a "Double top" to me, correct if I am wrong please.
But $2,45 will crack very soon, in my opinion.
Lets see what happens these days, don't no what price will be.
But the shit looks strong to me
this is just a thought , no advise

Head and Shoulders Formation on Matic?Possible head and shoulders formation here? However, Matic has been creating higher lows for months which is a bullish sign. Tough call on this one.


Matic usdtMatic on non stop train. Moving great compared with btc. This bull Matic gives good profit for holders.
Buy 1.7 to 2.3
Sell - on your wish.


More Matic. More Gann. Jan 30This is an update from my previous analysis on Dec 23. I've been drawing this Gann box for a few months and I have been able to trade some of the highs and lows based on my assumption that Matic will break out into the Gann and Fibonacci extension levels on or around Jan 30th. I use Gann boxes because of its relationship to time and market geometry. Feel free to zoom out on the page and study how I drew this box. If you like triangles, wedges, and trendlines, then a full-blown Gann box has everything you are looking for. Overlapping a Fib retracement box gives even more layers of geometry. Let's see what happens.
Not financial advice. Do your own due diligence. Have fun!
