Long Matic up to $2.2Below 1.75 we are no longer Bullish but above $1.8 we expect the pattern of retracements then pumps to continue.
MATICBULLUSD trade ideas

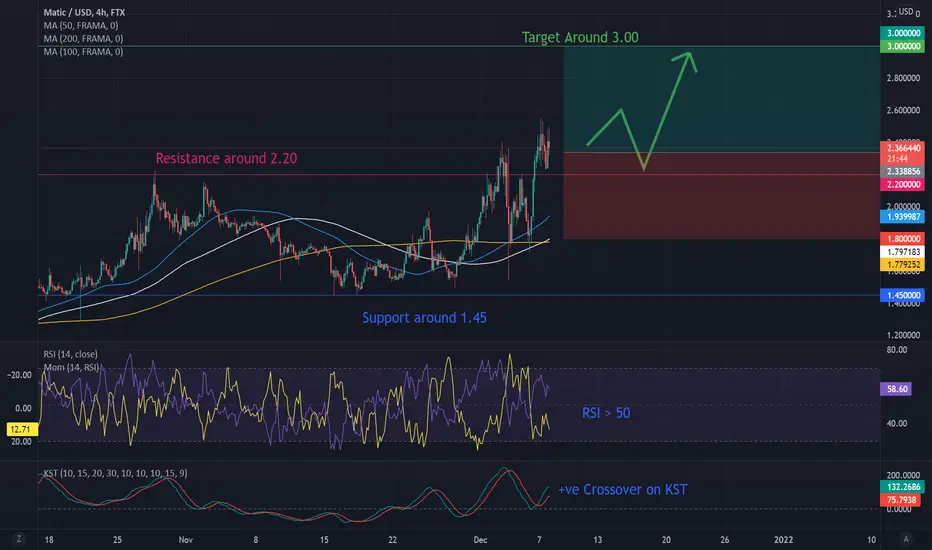
Potential Breakout in MATIC, Will Head Towards 3Trend Analysis
The main view of this trade idea is on the 4-Hour Chart. The cryptocurrency Polygon (MATIC) had been in a rangebound mode after hitting resistance around the 2.20 price level is late October 2021. The cryptocurrency found some support at the 1.45 price level where it made sharp moves higher over the last couple of weeks, testing and breaking above 2.20. Expectations are for MATIC to continue this move higher, with a target of 3. Failure of this projection will see MATIC trading around 1.80.
On the Daily Chart MATIC is in an upward trajectory, with some resistance around the 2.5 price level.
Technical Indicators
There has been recent crossovers on the short (50-MA), medium (100-MA) and long (200-MA) fractal moving averages. MATIC is currently trading above all 3, which is a bullish sign. The RSI is above 50 with the KST recently making a positive crossover.
Recommendation
The recommendation will be to go long at market, with a stop loss at 1.8 and a target of 3.0. This produces a risk/reward ratio of 1.23.
Disclaimer
The views expressed are mine and do not represent the views of my employers and business partners. Persons acting on these recommendations are doing so at their own risk. These recommendations are not a solicitation to buy or to sell but are for purely discussion purposes. At the time of publishing I have exposure to MATIC.
MATICWe shared some profitable MATIC setups over the last 3 weeks.
Now, MATIC is near a key diagonal support level (log scale) which has always acted as support since April 2022!
If this support fails, we might see MATIC coming to the next support zone between $1.5 and $1.6

MATIC - one of the few remaningETH, AVAX, SOL, etc. have fallen healthily below their bull market trend lines, and some have even back-checked them and rolled over.
The MATIC bull market looks different than these other players in that the bull market trendline (purple) is not at all a good guide for the price action in the time from then till now. It has, nonetheless be breached a few times now.
The long orange line is the best trendline to use, it is a price channel capturing most of the MATIC bull market minus the initial first parabolic rally. MATIC is still holding it for now.
MATIC is also not matching BTC's price action like the others, the general trends yes, but not the movement.
That said, the vacation is over if we drop below 1.60.

MATIC : UPDATEDEverything is on the chart .
I'm on MATICBEAR leverage token :) Looking forward to close it around 1.7-1.4
(and keep some for big bear smash)


MATIC/USDT long term viewMATIC/USDT is moving in parabolic direction while the fundamental is strong. The future is bright.


Matic still need a pullbackMatic is oversold on the 12H and needs a pullback. I am adding at 1.9 zone


simple analyse technique concernant MATIC la crypto monnaie matic est une crypto trés potentiale le graphique indique selon analyse technique que MATIC il a la posibilité d'augmenter avec le temps jusqu'a la prochain resistance.

Matic Long Term TargetKarnage's long term target for Polygon (MATIC) - has strong narrative in ZK rollups so could break resistance soon.

Most realistic path for MaticMatic seeing a nice methodical rise trading very technically which is very healthy, I would suspect we continue with that until we break through ATH then we can expand rather quickly, but unless we see bitcoin bounce back towards ATH i just don't think we see a crazy parabolic move like last time, but i've been long on this for quite some time and and that's not changing

MATICUSD wyckoff re-accumulationwyckoff re-accumulation COINBASE:MATICUSD MATICUSD BINANCEUS:MATICUSD

matic/usd Beautiful trend building upMatic has been following a trend with in the cannel pattern making it easier for us to know entries & exits.

MATICUSD LONGVolume on the faily chart has really picked up. All in support of the break of $2 and surge to ATH's.

Correction expected on MATICMATIC is still in uptrend channel but is expected to take a short term correction.

Rising Channel in play - discussionThere is a healthy negative correlation between MATIC and BTC
this is the primary reason why MATIC rose by nature during the flash crash.
now power packed by various whale pumps during the week,
we finally have an obvious looking ascending channel.
the question now is,
how far will it go?
the rest of the Coins who have high correlation between BTC such as GRT/VECHAIN,
have shown the formation of the Inverted Head and Shoulders/Diamond Bottom, and is supposed to bounce back by nature.
this means that MATIC might fall, which is a common thing in a diverse portfolio.
Will the whale pumps continue to bring us to a parabolic rally?
either of these does not bode well for us,
if MATIC were to continue to rise, it might actually give us clues that BTC will fall.
which will have a greater impact on the overall market.
thoughts?

$MATIC To The Moon, But... Wait a LittleSo everything suggests that $MATIC is going to the moon or at least reach a new ATH soon enough. As we can see in the chart, it broke out of the triangle but if we look at the RSI and the price (red dotted lines) we see there's a regular divergence which suggests a reversal, a bearish one. Also, if you look at the past retracement, it seems that it likes to pull right under 0.618 where it forms a strong support and bounces upward. The only time it went below was in May - July but we all know that was an anomaly since the entire market took a pretty brutal dump. I think we will see $MATIC under $1.90 before it takes off. I might be totally off but I am setting my buy order at $1.88. I would rather lose an opportunity than lose my capital when the market is this fickle. But one thing I am quite certain is that $MATIC will see ATH pretty soon. Not financial advice.

NEO 2017-18 - MATIC 2021-22Fractal pattern detected. Matic is coming close to break the resistance and go to new all-time highs

$MATIC UPDATEMATIC has a huge announcement tomorrow, Dec. 9th
I've been bullish on this for a long time!
Should be a big one for the med-term now that leverage is cleared from crypto market.
Comment if you have any questions!!

$MATIC AND ETHEREUM BULL FLAG OBSERVATIONI expect both polygon and ethereum to complete the flag pattern extension somewhere in the grey box. ethereum is already well inside the box, and it looks likely to move higher. polygon has been unusually strong during the pullbacks and I believe it is searching for valuation. It seems polygon has much more upside to come at this point.
Currently over 3000 protocols have migrated to the Polygon network!
view here: awesomepolygon.com
Polygon combines the best of Ethereum and sovereign blockchains into a full-fledged multi-chain system.
Polygon solves pain points associated with Blockchains, like high gas fees and slow speeds, without sacrificing on security. This multi-chain system is akin to other ones such as Polkadot, Cosmos, Avalanche etc, but with at least three major upsides:
1. It is able to fully benefit from Ethereum’s network effects
2. It is inherently more secure
3. It is more open and powerful
this information is not a recommendation to buy or sell. please conduct your own research before investing.

MATIC FINISHING WAVE 5 TIME TO SHORT SOONJust an idea, Matic looking to close wave 5 soon. Next move is an ABC correction. (also depends if btc can regain momentum flipping R/S at 53.4k)
