LoadingFor MATIC to get back in the game it must break and retest the 0.3010 price area, The oscillators are looking healthy let's hope we continue to get some good price action!
MATICPERP trade ideas

Short Term• Support Zone: 0.2811
• Resistance Levels: 0.2871, 0.3168
• Entry: After breakout and confirmation above 0.2871
• Take Profit (TP): 0.3168
• Stop-Loss (SL): Below 0.27

Matic might show reversal here• Support Zone: 0.27
• Resistance Levels: 0.35, 0.40 - 0.45
• Entry: 0.27 - 0.28
• Take Profit (TP): 0.35, 0.40 - 0.45
• Stop-Loss (SL): Below 0.25

Watch closely polygon movement On the chart you can see the previous movement how happened
All the points are shown on the chart
I expect a trend on matic that can lead us to see 1$ if we break the of 0.44$
Under 0.44$ the price will swing between 0.28$ to 0.43$ but if we break the resistant of 0.44$ and i do expect it, the target going to be 1$

MATICUSD - Still WaitingMATIC is a popular altcoin that I believe is undervalued
I have a target of $10 for myself
I think the run will be a very fast run up similar to the first run up
My thoughts are plotted with the bars pattern tool in green
The run will occur during an alt season that is yet to come
The horizontal support is the dotted line
What are your thoughts on MATIC?

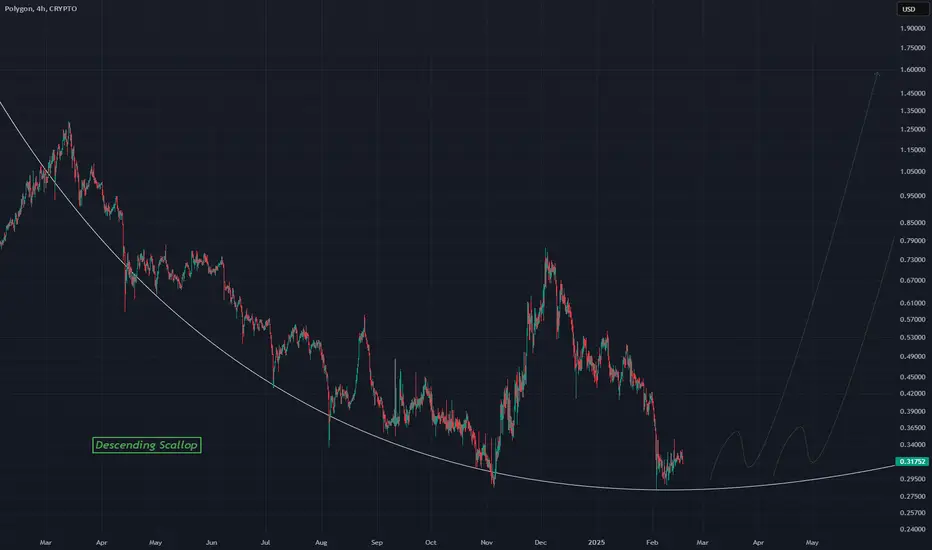
MATICUSD - Descending Scallop Reversal PatternA reversal pattern on this 4Hr chart for MATIC
MATIC has been beaten down hard and is due for a reversal and this pattern suggests it
Price slowly will flip towards the bulls favor and they will take control
The scallop pattern can be identified by a curve like this, this one being a descending one
Again the 4Hr chart
Hitting a bottom on MATIC?...I don't really trade Crypto's however this one stood out to me as a potential opportunity on the weekly time scale.
MATIC has been trending down since late 2021 but it has always shown a bounce around the $0.30 zone, ultimately creating a very large descending triangle coupled with a MACD that has been diverging up.
Could we see a rally ahead towards $1.00+? well that remains to be seen but I liked the setup and took the opportunity. Should be interesting in how this develops and thus, I'll be keeping an eye on this one.
I'm also checking out DOGE and XRP.
As always, Good Luck & Trade Safe.

MaticHistoric all time low levels, breaking above and holding as support. 4:1 reward to risk. undeniable accumulation on the 4 hour as well


POLYGON - Is it set to fly With the MACD turning in some green bars with a cross of the MA's , Bears are exausted pushing price to a key resistance/ support level- will alt bulls please enter and take control. Also we are looking at a falling wedge . We need to maintain support , this should happen as eyes turn to alts . If support closes below on daily, analysis is void.

Value Zone and SAR indicator Please observe that MATIC is in a theoretical value zone, keep in mind when this asset/crypto reach this zone in the past it at times had a price reversal, use this concept with the SAR indicator, to maximize confluence in addition with the SRSI and RSI for a better price prediction. Please be careful and remember this is crypto and be alert that the asset does not fall out the value zone. Please see chart for key levels.

Hope the key levelThere is a key level on the hourly chart, I labeled it Hope, if price can reverse from that level we can continue the uptrend. Hope is also on the bottom of a Fair Value Gap. If price falls below 0.30 we are bearish. Let's hope for a bullish reversal candle and a bullish MACD(Chris Moody) soon.

Perfect Time to Long POL(MATIC) – Targeting $1.1-1.3This is kind of similar to my recent EURONEXT:PYTH post.
CRYPTOCAP:ETH has been battered, and ETH/BTC has trended down for years—nothing new. Every cycle plays out the same way. In 2025, Ethereum will likely push past $7K, with the best-case scenario above $16K. When that happens, Layer 2s will follow.
Polygon has repeatedly bounced from the $0.30-$0.35 range, rallying hard when the market turns. This is a no-brainer long opportunity.
CRYPTO:MATICUSD

MATICUSD - Pivot Points - LIVE ORDER FLOW UPDATECorrelation with VARA is strong, MATIC price action drawn down by FUD pulling price into a bullish pocket.
Order Flow (Bookmap) Pivot Levels
$0.62 (Bearish Pivot)
$0.3751 (Bullish Pivot)
65% PLUS LONG POTENTIAL

POL/USDT | 1W🩸 PSX:POL ⁀➷
#Polygon. Macro chart Another
💯 Intermediate Target - $0.85
🚩 Macro Target 1 - $1.20
🚩 Macro Target 2 - $1.70
🚩 Macro Target 3 - $2.45
- Not financial advice, trade with caution.
#Crypto #Polygon #POL #Investment #L1
✅ Stay updated on market news and developments that may influence the price of Matic. Positive or negative news can significantly impact the cryptocurrency's value.
✅ Exercise patience and discipline when executing your trading plan. Avoid making impulsive decisions driven by emotions, and adhere to your strategy even during periods of market volatility.
✅ Remember that trading always involves risk, and there are no guarantees of profit. Conduct thorough research, analyze market conditions, and be prepared for various scenarios. Trade only with funds you can afford to lose and avoid excessive risk-taking.

MATIC returning to equilibrium would be a 128% gain from here!MATIC is looking extremely undervalued at current levels. The price has pulled back considerably since the "Trump election pump" and is forming a nice wedge on the 4-hour chart, which is currently on a four-count. A price move back to equilibrium from the wedge's bottom trendline would, by itself, result in approximately a 128% gain.
Longer term, if the price breaks out of the monthly chart wedge pattern (see comments below for the chart), which is also currently trading at a four-count, we could see some incredible price appreciation over the next 6 to 9 months.
Good luck, and always use a stop-loss!

MATICUSD Big Breakout Price within this triangle will lead to a large breakout
A triple bottom is the main cause for this bull situation
BULLISH LONG TERM
Matic$

MATICUSD - Bullish SqueezeOn the flip side of VARA we have this correlated asset which is + about 20% above VARA, thus there is a very high likelihood that VARA will pump should Polygon break as I predict in this diagram. There are several correlated assets that are entering into a bullish squeeze this morning, seemingly one after another. VARA has already broken out to around 10% in this regard I suspect MATIC will do the same and it will feed VARA momentum.

MATICUSD Bullish Squeeze TightensThis bullish squeeze has confirmed up to the 2 hour chart, which at this point is getting into higher time frame levels for day trade strategies. The probability of a bullish outcome remains the same at about 80% however long flat price action such as this can result in a violent expansion of the B Bands. I actually stake every coin I buy so this isn't really useful to me but thought I would share.

MATIC (Polygon), Long, 1Dentry: Current Market Price
take profit: 0.5250
stop loss: 0.0400
MATIC is currently trading within a support zone and forming a bullish flag pattern. This indicates potential upward momentum as it aims to break through the resistance at 0.4950.
buy 🚀
✅ Like and subscribe to never miss a new analysis! ✅

Polygon at Key Support Zone - Will It Bounce to 0.4700?COINBASE:MATICUSD has reached a significant support level that has previously attracted buying interest, often resulting in bullish recoveries. This level aligns with previous market reactions, highlighting its role as a key area to watch.
If the support holds and bullish confirmation emerges—such as bullish engulfing candles or long lower wicks—a move toward the 0.4700 level is anticipated. However, if the support is broken, the bullish outlook could be invalidated, opening the door for further bearish momentum.
Traders should closely monitor this zone for signs of buyer strength before considering long positions. As always, risk management is essential to mitigate potential losses.

POLYGONPolygon (previously Matic Network) is the first well-structured, easy-to-use platform for Ethereum scaling and infrastructure development. Its core component is Polygon SDK, a modular, flexible framework that supports building multiple types of applications.
We can see a triangle pattern on the chart and divergence by RSI on the weekly timeframe.

MATIC: nice setupMATIC: nice setup
-Quasimodo structure.
-ABCD pattern.
-Key level support.
-Demand zone support.
Upon breaking out of down channel, Matic will welcome Trump!
.
Wait n see!
