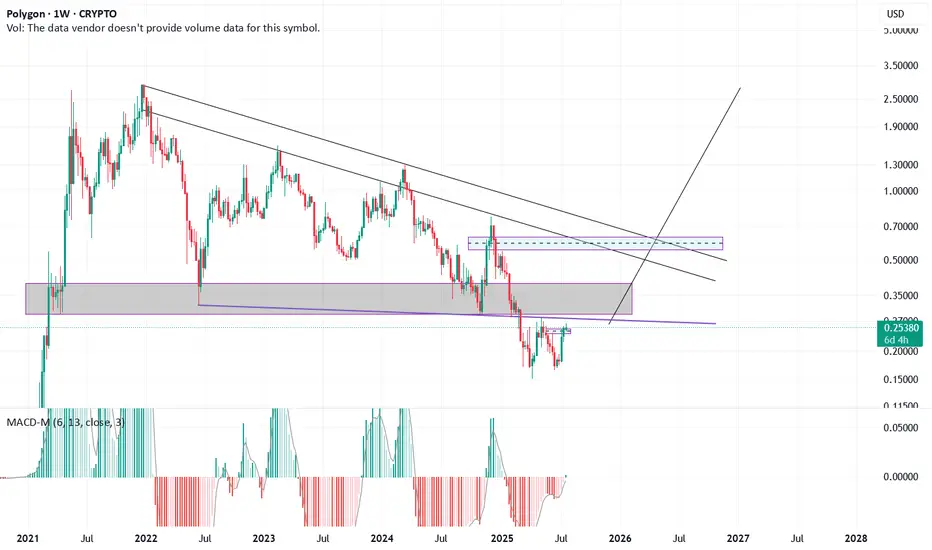
the price is in the uptrendGiven the positive price conditions, the price is in the uptrend, and then the gaza should wait for the long -term trend line to achieve at least its previous roof.
Key stats
About Polygon
Polygon is a layer-2 scaling solution that “brings the world to Ethereum” — working in tandem to create a multi-chain system where developers on Ethereum can create applications and smart contracts for lower gas fees and faster speeds. Put simply, it rolls up its sleeves and sorts out a lot of Ethereum’s drawbacks — at least pre-Ethereum 2.0 — while also taking advantage of its thriving ecosystem. As a sidechain, however, it doesn’t inherit Ethereum's security. Since its inception, Polygon has attracted adopters as famous as Disney, Prada, Adidas, and Instagram. Its native token MATIC is used for governance and transaction fees within the Polygon ecosystem, while also deployed as a settlement currency between users.
Related pairs
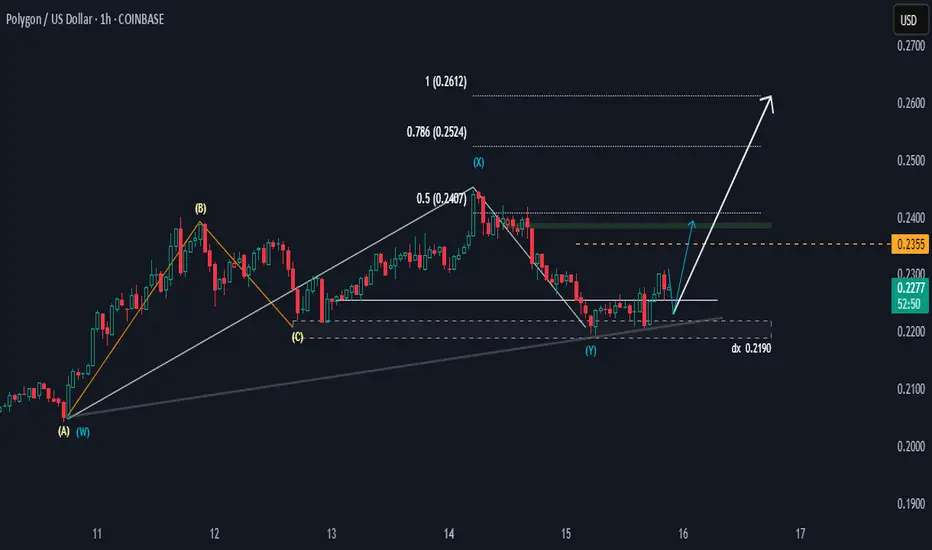
MATICUSD Bullish OutlookHi
MATICUSD is likely to pulse down and push up to 0.2355 for a bias of 0.2355.
We could also see a price rally up to 0.2524 and 0.2612, provided the 0.2190 holds; if not, then the setup will be invalid.
Happy trading,
K.
Easy 100% gainsI estimate that soon levels around 0.50$ will be reached and challenged, if it breaks than 0.7$ to 1.0$ are next to come.

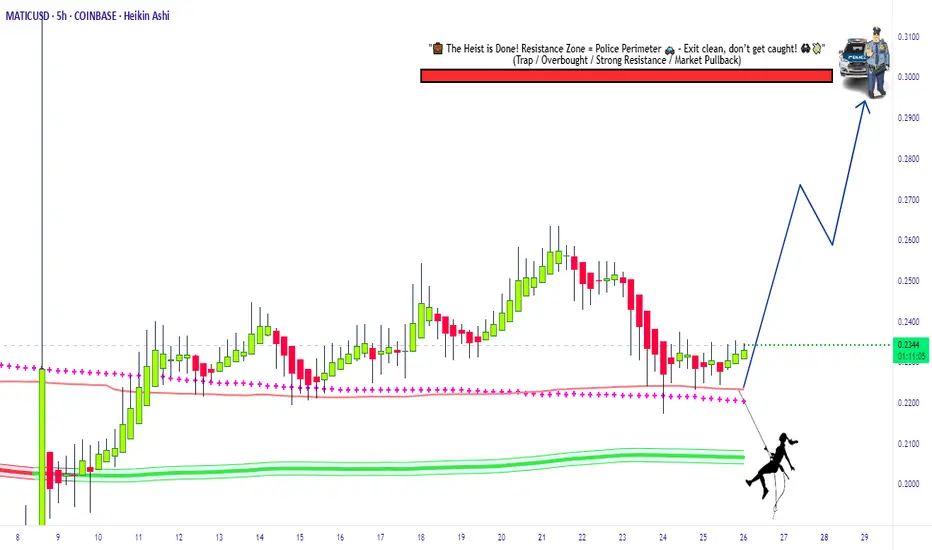
Swipe the Polygon Vault MATIC/USDT Bullish Heist Strategy🔥 MATIC/USDT Heist Plan: Swipe the Loot Before the Cops Clock In! 🏴☠️💸
🌍 Oi! Hola! Bonjour! Hallo! Marhaba!
💼 Welcome back, Money Makers & Market Bandits!
The Polygon (MATIC) vs Tether vault is wide open! Based on our 🔍 Thief Trading Style Analysis, it's time to plan the ultimate crypto chart robb
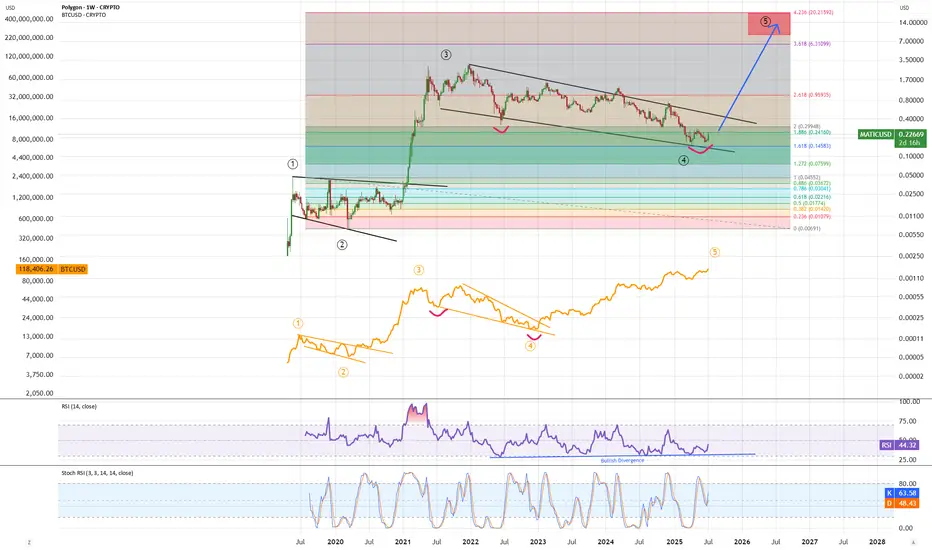
MATIC - time for impulse to new ATH!MATIC is doing same moves as BTC did just with a lag. We are oversold with bullish divergence in a falling wedge formation. Just like BTC did I expect Matic to breakout of falling wedge formation and push to new ATH for blowoff top - after that likely correction back to current level so make sure t
Is MATIC Nearing a Bottom or More Downside Ahead ?
Lower Highs & Lower Lows: The price consistently prints lower highs and lower lows, confirming a bearish structure.
The price is moving along the lower band, indicating persistent bearish pressure.
The middle band (moving average) is acting as a resistance level.
Support: Around $0.20 - $0.21 (

MATICUSD Looking BullishHello,
MATICUSD appears overall bullish on the H1 timeframe. Currently, the price seems to be stretching toward the 0.2355 resistance zone, which could lead to a potential bullish pullback.
The resistance at 0.2389 appears significant, with its opposite lower highs, suggesting some attention in th

Matic a.k.a Pol.. Could this be the moment?This is not a buy vall, just sharing the chart from my point of view.
Risk is yours, as always. Trade smart.
~TheChartMystic~

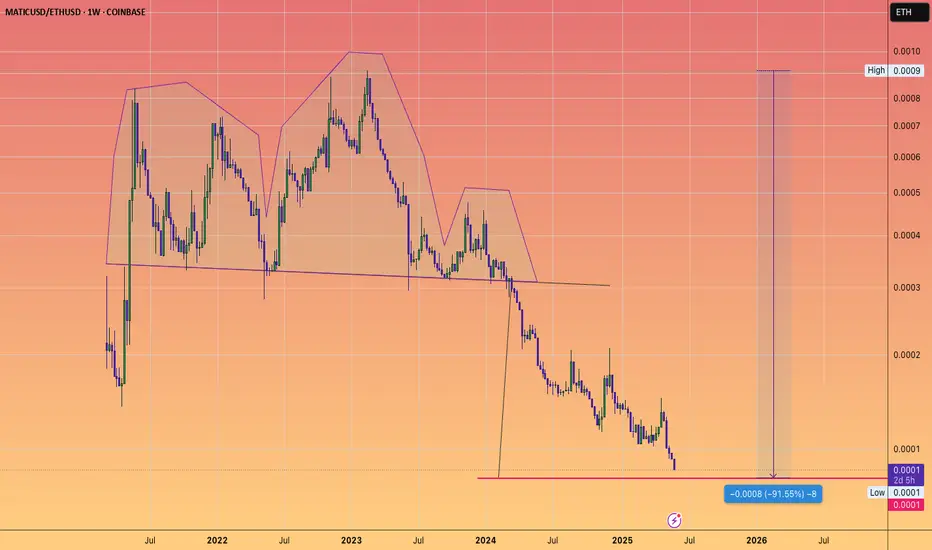
MATIC approaching Head and shoulders target...versus ETH
which would be a -91% loss of value versus the second most important crypto
nice buy opportunity for matic (polygan)we are facing the great support area around 0.21 if the paterns close at 0.23 by the end of the week we are going to have nice 30% rise

See all ideas
Summarizing what the indicators are suggesting.
Oscillators
Neutral
SellBuy
Strong sellStrong buy
Strong sellSellNeutralBuyStrong buy
Oscillators
Neutral
SellBuy
Strong sellStrong buy
Strong sellSellNeutralBuyStrong buy
Summary
Neutral
SellBuy
Strong sellStrong buy
Strong sellSellNeutralBuyStrong buy
Summary
Neutral
SellBuy
Strong sellStrong buy
Strong sellSellNeutralBuyStrong buy
Summary
Neutral
SellBuy
Strong sellStrong buy
Strong sellSellNeutralBuyStrong buy
Moving Averages
Neutral
SellBuy
Strong sellStrong buy
Strong sellSellNeutralBuyStrong buy
Moving Averages
Neutral
SellBuy
Strong sellStrong buy
Strong sellSellNeutralBuyStrong buy
Displays a symbol's price movements over previous years to identify recurring trends.
Curated watchlists where MATICUSD is featured.

ETH-based crypto: Find your utility
38 No. of Symbols

Gen 3 crypto: A new day dawns…
25 No. of Symbols

Proof of Stake: Seeking validation?
26 No. of Symbols

Smart contracts: Make the smart decision
36 No. of Symbols

Staking Coins: Pick up a stake
18 No. of Symbols

Top altcoins: Choose your alternatives carefully
28 No. of Symbols
See all sparks
Frequently Asked Questions
The current price of Polygon (MATIC) is 0.2356 USD — it has risen 0.17% in the past 24 hours. Try placing this info into the context by checking out what coins are also gaining and losing at the moment and seeing MATIC price chart.
Polygon price has fallen by −0.76% over the last week, its month performance shows a 31.38% increase, and as for the last year, Polygon has decreased by −52.61%. See more dynamics on MATIC price chart.
Keep track of coins' changes with our Crypto Coins Heatmap.
Keep track of coins' changes with our Crypto Coins Heatmap.
Polygon (MATIC) reached its highest price on Dec 27, 2021 — it amounted to 2.9249 USD. Find more insights on the MATIC price chart.
See the list of crypto gainers and choose what best fits your strategy.
See the list of crypto gainers and choose what best fits your strategy.
Polygon (MATIC) reached the lowest price of 0.1518 USD on Apr 7, 2025. View more Polygon dynamics on the price chart.
See the list of crypto losers to find unexpected opportunities.
See the list of crypto losers to find unexpected opportunities.
The safest choice when buying MATIC is to go to a well-known crypto exchange. Some of the popular names are Binance, Coinbase, Kraken. But you'll have to find a reliable broker and create an account first. You can trade MATIC right from TradingView charts — just choose a broker and connect to your account.
Crypto markets are famous for their volatility, so one should study all the available stats before adding crypto assets to their portfolio. Very often it's technical analysis that comes in handy. We prepared technical ratings for Polygon (MATIC): today its technical analysis shows the buy signal, and according to the 1 week rating MATIC shows the sell signal. And you'd better dig deeper and study 1 month rating too — it's sell. Find inspiration in Polygon trading ideas and keep track of what's moving crypto markets with our crypto news feed.
Polygon (MATIC) is just as reliable as any other crypto asset — this corner of the world market is highly volatile. Today, for instance, Polygon is estimated as 1.81% volatile. The only thing it means is that you must prepare and examine all available information before making a decision. And if you're not sure about Polygon, you can find more inspiration in our curated watchlists.
You can discuss Polygon (MATIC) with other users in our public chats, Minds or in the comments to Ideas.