Polygon matic multi year breakoutPolygon matic on huge multi year breakout and it's trading within bullish penant pattern.
Breaking out of bullish penant with 0.5$ above could confirm that move.
Ideal Target will be 1.618 fib level of price level 4.5-4.75$, if 0.19 confirms as bottom..
MATICUSD trade ideas

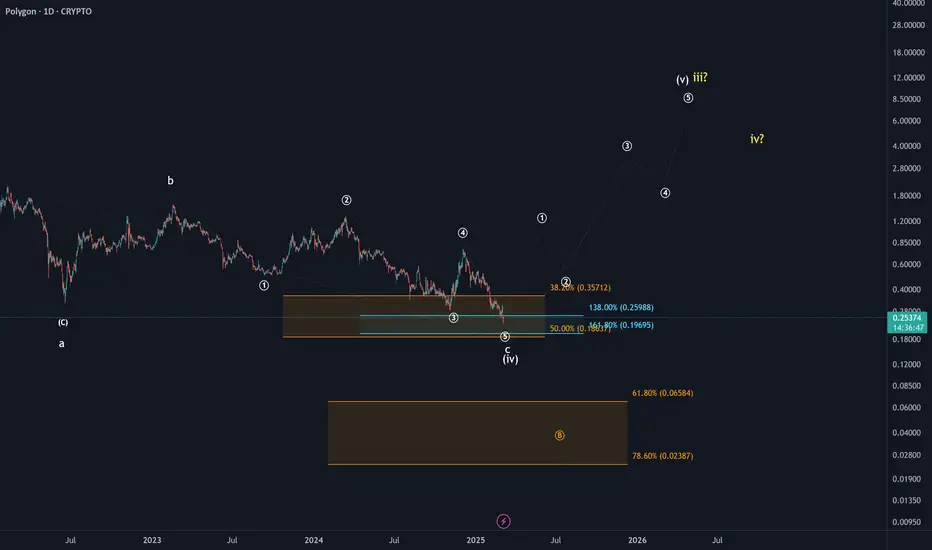
MATIC / USD [Polygon] EWP TC FIB ANALYSIS WEEKLY TFElliott Wave Analysis for MATIC/USD (Polygon) 1W Time Frame Chart
The chart presents a detailed Elliott Wave analysis with corrective patterns, Fibonacci levels, and a long-term price projection.
MATIC is currently in a final corrective phase (Wave C of an ABC correction) within a descending channel.
A potential bottom formation near the 0.618–0.65 Fibonacci retracement level (~$0.19 - $0.22) suggests a possible trend reversal. (Strong support zone)
The RSI (Relative Strength Index) is in the oversold zone, indicating that selling pressure may be exhausting.
The previous bullish impulse (Wave (5)) ended around $2.75
This was followed by an WXY corrective multi zigzag, which appears to be reaching its final stage. The chart suggests that Wave (C) of the correction is nearing completion.
Bearish Scenario:
If the $0.19 - $0.22 support fails, further downside towards $0.10 - $0.05 is possible.
However, this scenario would likely require a broader crypto market downturn.
Conclusion: Potential Long-Term Trend Reversal
The current zone suggests a possible bottom formation, which could lead to a new bullish cycle.
A breakout above $0.42 - $0.50 with strong volume would confirm the trend reversal.
Traders might consider accumulation in this range with a stop-loss below $0.17.
Overall Outlook: Bullish mid-term outlook once the bottom is confirmed.

Is MATIC Nearing a Bottom or More Downside Ahead ?
Lower Highs & Lower Lows: The price consistently prints lower highs and lower lows, confirming a bearish structure.
The price is moving along the lower band, indicating persistent bearish pressure.
The middle band (moving average) is acting as a resistance level.
Support: Around $0.20 - $0.21 (current price zone), as it appears to be stabilizing near the lower Bollinger Band.
Resistance: Near $0.28 - $0.30 (middle Bollinger Band) and a stronger resistance at $0.35.
Volume has been relatively low, suggesting weak buying interest.
If $0.20 breaks down, the next strong support might be around $0.15.

Downward ChannelOptimal Trading Strategies Based on Key Levels
✅ Bullish Scenario: If Price Holds Above $0.30
Entry: Above $0.31 (Confirmed breakout).
Stop-Loss: Below $0.27 (Invalidation).
Target 1: $0.40 (Key resistance).
Target 2: $0.51 (ChoCh & major trend reversal point).
Risk-to-Reward (R/R): 3:1 or better.
✅ Best Confluence:
If price retests $0.30 as support after breaking above, it strengthens the long setup.
Volume confirmation is key—low volume breakout = fakeout risk.
📉 Bearish Scenario: If Price Rejects Below $0.30
Entry: Below $0.28 (Breakdown confirmation).
Stop-Loss: Above $0.32 (Invalidation).
Target 1: $0.20 (Next major support).
Target 2: $0.15 - $0.10 (Liquidity sweep area).
R/R Ratio: 2.5:1 or better.
✅ Best Confluence:
Rejection at $0.30 = Bears remain in control.
If price fails to reclaim $0.30 and breaks down, it signals continuation to lower targets.
🚀 Final Takeaway
✔ $0.30 Breakout = Early Long Signal (Targeting $0.40 - $0.51).
✔ $0.51 Breakout = Full Trend Shift Confirmation.
✔ Rejection Below $0.30 = Bearish Continuation (Targeting $0.20 - $0.10).

MATICMATIC created a potential bearish flag pattern from the June low.
It was easy to guess the top of the flag and the start of the descent.
At this moment, the lower trend line of the flag is broken.
It's hard for me to predict what the way down will look like, maybe it will test the trend line from below or even make a false reversal. Short positions would have it very easy if it only went down.
However, I think it will test the area of the June low by the end of the year, and if it holds and other conditions are met, there could be an upward turn.

(MATIC) POLYGON "past ticker"Polygon was originally listed to Coinbase on 3/11/2021. Now what was MATIC goes by POL. POL was listed during September of 2024. For whatever reason it seems like Polygon (POL) has not seen as much attention as with when Polygon was (MATIC). Also, Solana (SOL) has been the main avenue of attention for the last couple of years outside of the mass appeal for NFTs on Ethereum's blockchain and Bitcoin payment system, savings adjusted reality.

Trade is closedTrade is closed I had my support line
And it got broke
Now it's below 0.2435$
That's where my stop loss
Trade is closed
The bullish signal was fake from the chart
WTF with project

Alert: Polygon have a bullish signalOn polygon chart, the price touch four times does heavy support resistance.
It is obviously that polygon ready to go up
The tips going to be
1/ Tip one 0.30$
2/ Tip two 0.41$
3/ Tip three 0.52$
It is on the bottom, just try to find the best entry price
Please avoid use leverage or otherwise you will be ending on lose because the price may go up and down and you can lose your money once.
Good luck

POL: Key Support Holding or Deeper Correction Ahead?POL: From a price perspective, the pullback into support between $0.186 and $0.357 aligns well with the idea of a fourth wave within a larger upside impulse. However, the prolonged nature of this retracement reduces confidence in that outlook. Given the complexity of the correction and the broader position within the crypto cycle, a break of support and a deeper correction remain plausible. In that scenario, a test of the $0.023 - $0.065 region could come into play. It may be prudent to wait for a clear confirmation of a local low before turning bullish on this chart again.
Great buying opportunityHello traders MATIC is providing a great buy swing opportunity here. Yes we are putting in lower lows and this could even fall to 0.06C as this is the next support on the weekly chart. Demand zone marked in green box. Stochastic RSI beaten down but could stay down further as price falls. I will be taking a long on this and DCA on the way down. If it hits that 0.06C I will load up on Matic and target $1-$1.30 as my take profit

LoadingFor MATIC to get back in the game it must break and retest the 0.3010 price area, The oscillators are looking healthy let's hope we continue to get some good price action!

Short Term• Support Zone: 0.2811
• Resistance Levels: 0.2871, 0.3168
• Entry: After breakout and confirmation above 0.2871
• Take Profit (TP): 0.3168
• Stop-Loss (SL): Below 0.27

Matic might show reversal here• Support Zone: 0.27
• Resistance Levels: 0.35, 0.40 - 0.45
• Entry: 0.27 - 0.28
• Take Profit (TP): 0.35, 0.40 - 0.45
• Stop-Loss (SL): Below 0.25

Watch closely polygon movement On the chart you can see the previous movement how happened
All the points are shown on the chart
I expect a trend on matic that can lead us to see 1$ if we break the of 0.44$
Under 0.44$ the price will swing between 0.28$ to 0.43$ but if we break the resistant of 0.44$ and i do expect it, the target going to be 1$

MATICUSD - Still WaitingMATIC is a popular altcoin that I believe is undervalued
I have a target of $10 for myself
I think the run will be a very fast run up similar to the first run up
My thoughts are plotted with the bars pattern tool in green
The run will occur during an alt season that is yet to come
The horizontal support is the dotted line
What are your thoughts on MATIC?

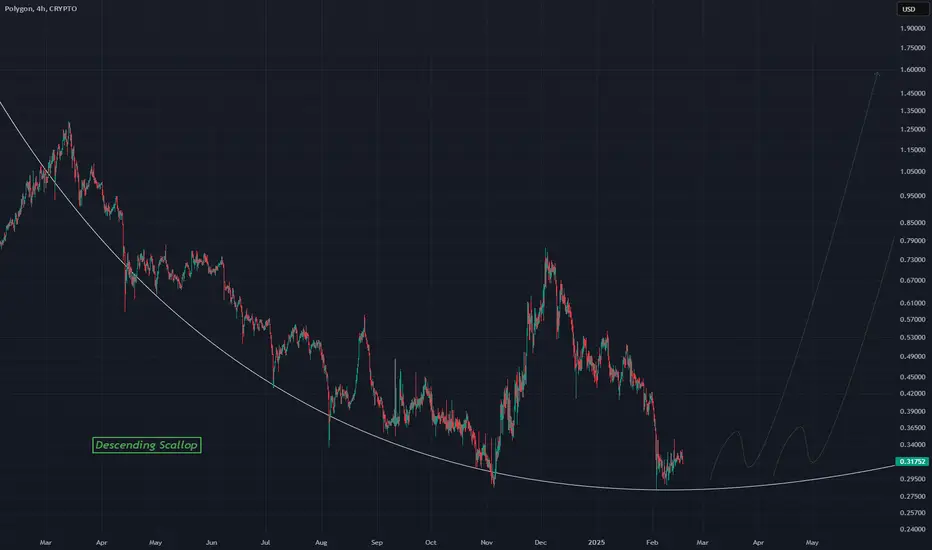
MATICUSD - Descending Scallop Reversal PatternA reversal pattern on this 4Hr chart for MATIC
MATIC has been beaten down hard and is due for a reversal and this pattern suggests it
Price slowly will flip towards the bulls favor and they will take control
The scallop pattern can be identified by a curve like this, this one being a descending one
Again the 4Hr chart
Hitting a bottom on MATIC?...I don't really trade Crypto's however this one stood out to me as a potential opportunity on the weekly time scale.
MATIC has been trending down since late 2021 but it has always shown a bounce around the $0.30 zone, ultimately creating a very large descending triangle coupled with a MACD that has been diverging up.
Could we see a rally ahead towards $1.00+? well that remains to be seen but I liked the setup and took the opportunity. Should be interesting in how this develops and thus, I'll be keeping an eye on this one.
I'm also checking out DOGE and XRP.
As always, Good Luck & Trade Safe.

MaticHistoric all time low levels, breaking above and holding as support. 4:1 reward to risk. undeniable accumulation on the 4 hour as well


POLYGON - Is it set to fly With the MACD turning in some green bars with a cross of the MA's , Bears are exausted pushing price to a key resistance/ support level- will alt bulls please enter and take control. Also we are looking at a falling wedge . We need to maintain support , this should happen as eyes turn to alts . If support closes below on daily, analysis is void.

Value Zone and SAR indicator Please observe that MATIC is in a theoretical value zone, keep in mind when this asset/crypto reach this zone in the past it at times had a price reversal, use this concept with the SAR indicator, to maximize confluence in addition with the SRSI and RSI for a better price prediction. Please be careful and remember this is crypto and be alert that the asset does not fall out the value zone. Please see chart for key levels.

Hope the key levelThere is a key level on the hourly chart, I labeled it Hope, if price can reverse from that level we can continue the uptrend. Hope is also on the bottom of a Fair Value Gap. If price falls below 0.30 we are bearish. Let's hope for a bullish reversal candle and a bullish MACD(Chris Moody) soon.

Perfect Time to Long POL(MATIC) – Targeting $1.1-1.3This is kind of similar to my recent EURONEXT:PYTH post.
CRYPTOCAP:ETH has been battered, and ETH/BTC has trended down for years—nothing new. Every cycle plays out the same way. In 2025, Ethereum will likely push past $7K, with the best-case scenario above $16K. When that happens, Layer 2s will follow.
Polygon has repeatedly bounced from the $0.30-$0.35 range, rallying hard when the market turns. This is a no-brainer long opportunity.
CRYPTO:MATICUSD
